
Figure 5. Sevoflurane preconditioning strengthened microglial phagocytosis and secretion of BDNF activities.
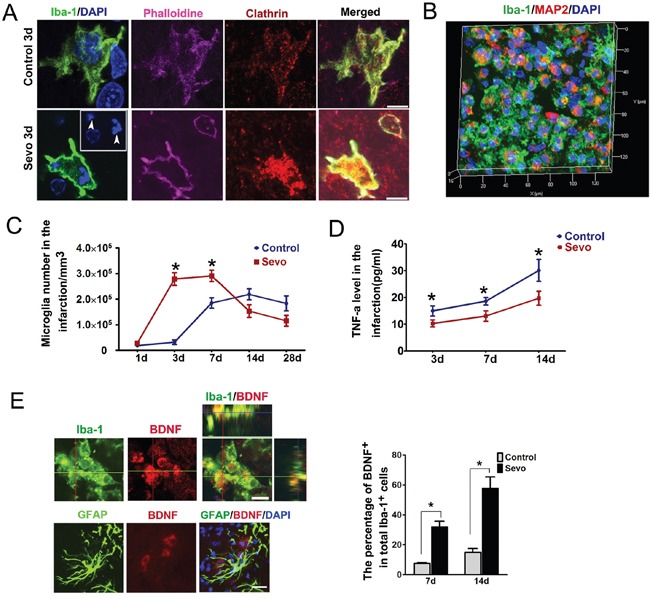
A. Phalloidin, Clathrin and Iba-1 stained microglia in the infarct in the Sevo and the Control groups on day 3 (Arrows indicate nuclear debris), Scale bar, 5μm. B. Three-dimensional image of inclusion of Iba-1 stained microglia and MAP2 debris in the infarction region in Sevo group on day 3. Histogram represented comparison of activated microglia that phagocytized cell debris between the two groups in the infarct on day 3; #*P<0.05, n=8. C. Comparison of ameboid microglia counts in the infarct between the two groups on days 1, 3, 7, 14 and 28; *P<0.05, n=8. D. Comparison of TNF-a expression determined by ELISA in the infarct between the two groups on days 3,7 and 14 ; *P<0.05, n=8. E. Ortho image demonstrating BDNF secretion by microglia in the infarct in Sevo group, Scale bar, 10μm; Histogram showed comparsion of BDNF-positive microglia in the infarct region in the Sevo group and the Control group on days 7 and day 14; *P<0.05; Representative image showed BDNF was not secreted by GFAP positive astrocytes in the infarct in the Sevo group. Scale bar, 40μm.