
Figure 5. E-Cadherin Level Predicts Drug Sensitivity in SCLC.
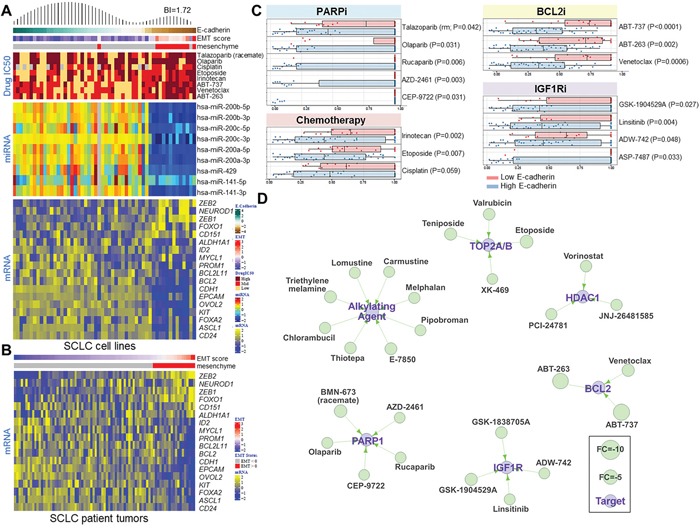
A. Heatmap of SCLC cell lines ranked by E-cadherin protein levels demonstrating a bimodal distribution pattern (BI=1.72). Cell lines with EMT scores greater than 0 are classified as mesenchymal. Correlation of E-cadherin expression and the IC50 values of PARP inhibitors, standard-of-care chemotherapy drugs, and BCL2 inhibitors. miR200 family microRNAs are strongly correlated with E-cadherin levels and EMT score. Expression analysis of a subset of genes involved in SCLC progression that are correlated with E-cadherin expression. B. A heatmap of 70 tumor samples from treatment-naïve SCLC patients ranked by EMT score shows the expression analysis of the same subset of genes as in the SCLC cell lines. C. High E-cadherin levels are associated with sensitivity to several drug classes, including PARP inhibitors, chemotherapy drugs, BCL2 inhibitors, and IGF1R inhibitors. D. A drug interaction network shows classes of drugs that are effective in SCLC cell lines with high E-cadherin levels.