Figure 1.

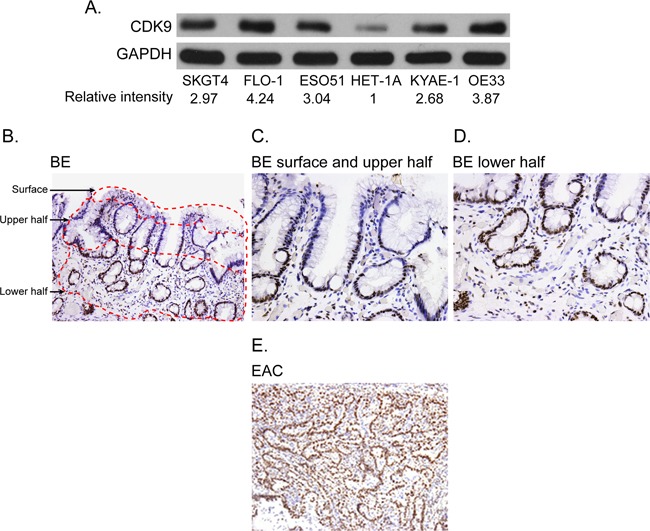
(A) Western blot showing CDK9 expression in the esophageal adenocarcinoma and normal squamous epithelial cell lines (HET-1A). Band intensity was measured with Photoshop software. Data is normalized with GAPDH and presented as the relative values to the HET-1A cells. (B-E) CDK9 protein expression by immunohistochemistry in matched samples of Barrett's Esophagus (1B, 100X magnification, 1C and 1D 200X magnification) and esophageal adenocarcinoma (1E, 100 X magnification).
