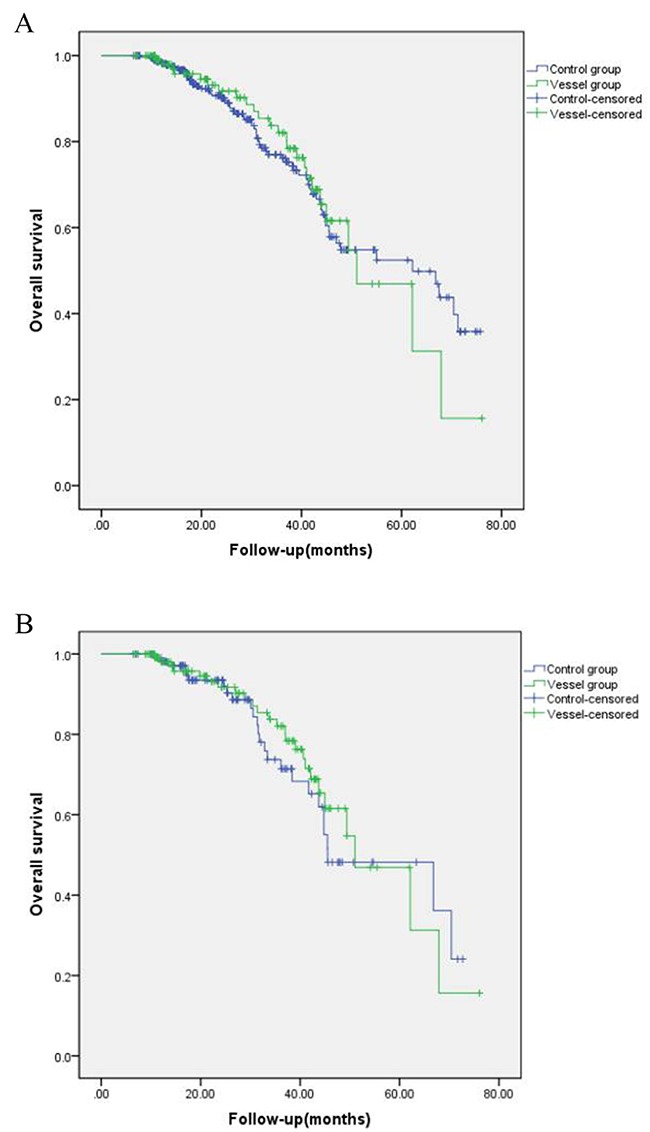
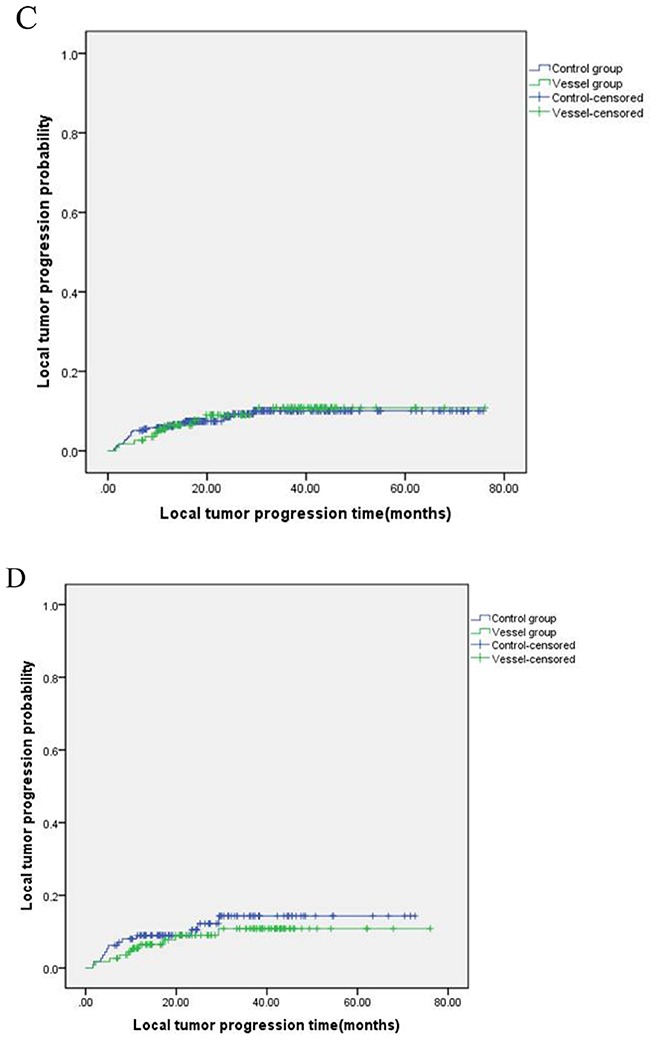
Figure1. Kaplan–Meier curves of HCC patients with different tumor location.


(A) overall survival before matching; (B) overall survival after matching. (C) local tumor progression before matching; (D) local tumor progression after matching.


(A) overall survival before matching; (B) overall survival after matching. (C) local tumor progression before matching; (D) local tumor progression after matching.