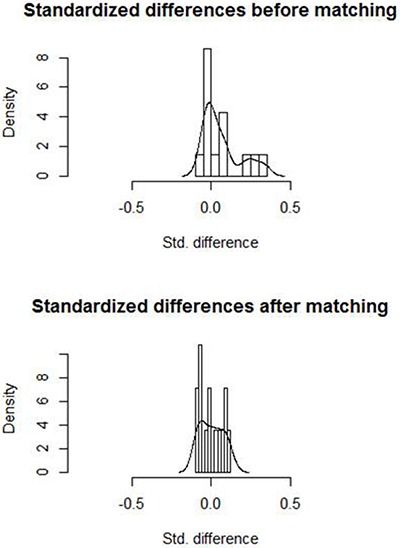
Figure 2. Histograms with overlaid kernel density estimates of standardized differences before and after matching.

Standardized differences were centralized around zero, indicating a good matching.

Standardized differences were centralized around zero, indicating a good matching.