
Figure 6. Bi-nucleated cells in mixed spheroids.
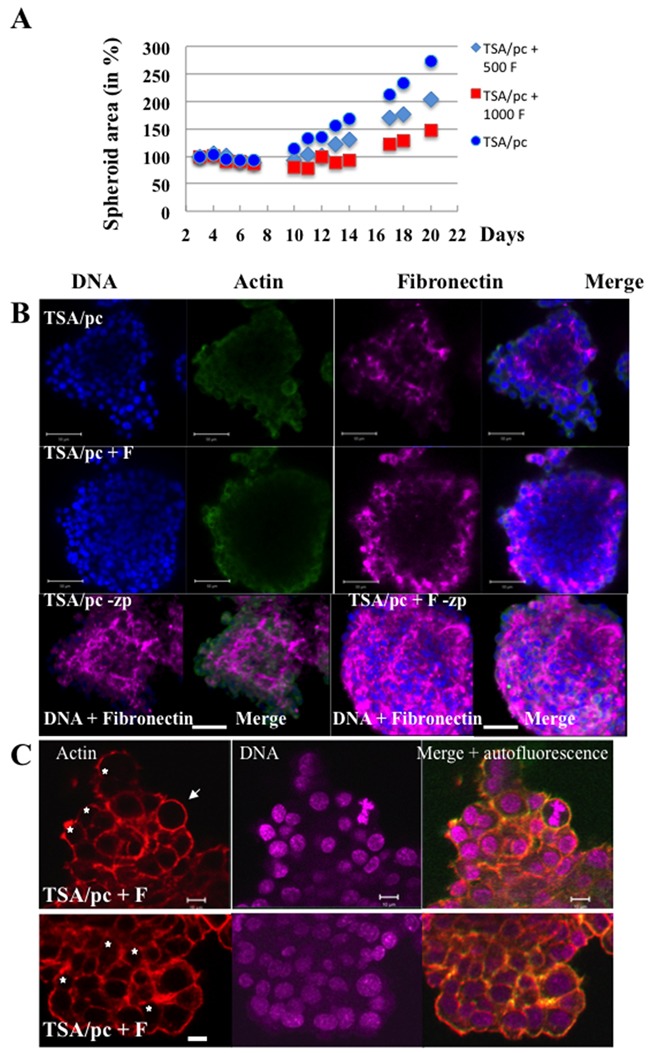
(A) mixed spheroids were established with TSA/pc cells (1000) and 3T3-fibroblasts (500 F or 1000F). The expansion of the spheroids was followed over time. (B) immunofluorescences were realized on whole spheroids and fibronectin was detected (shown in magenta). DNA and actin fluorescent signals were imaged on spheroid optical sections as fibronectin was also detected (shown in magenta). A 3D projection of the whole fluorescence is shown and indicated as –zp. The bars represent 50 μm. (C) Binucleated cells are detected in mixed spheroids and indicated by stars. The white arrow highlights a metaphase. The bars represent 10 μm.