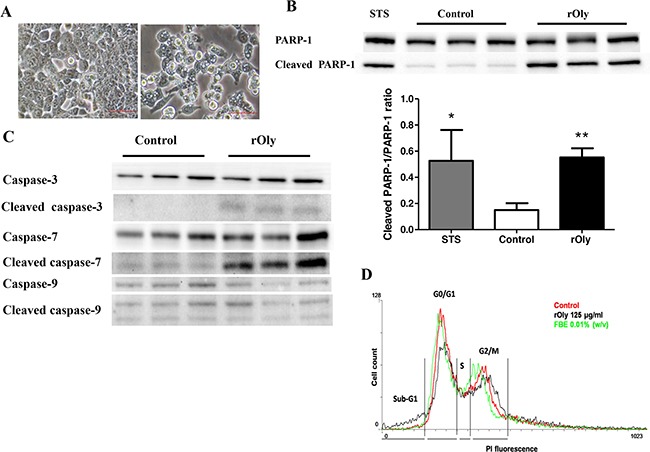
Figure 3. Recombinant ostreolysin (rOly) induces apoptosis in HCT116 cells.

A. Morphological changes after 8 h of rOly stimulation. HCT116 cells in the absence of rOly (left) compared to HCT116 cells treated with 125 μg ml−1 rOly (right). Scale bars = 50 μm. B. Cells were treated, or not (Control), with 125 μg ml−1 rOly for 8 h. PARP-1 (top panel) and cleaved PARP-1 (bottom panel) proteins were detected by western blot, and densitometry analysis of the western blot data was performed. Cells treated with 1 μM staurosporine (STS) were used as positive controls. Values are means ± SEM (STS n = 3, Control and rOly n = 8). *P < 0.05 and **P < 0.01 vs. control (one-way ANOVA–Dunnett's test). The results are presented as means of three independent experiments. C. Cells were treated, or not (Control), with 125 μg ml−1 rOly for 8 h. Expression levels of caspase-3, cleaved caspase-3, caspase-7, cleaved caspase-7, caspase-9 and cleaved caspase-9 proteins were detected by western blot. This is one representative experiment out of three independent experiments. D. Cells were treated with 125 μg ml−1 rOly or 0.01% fruiting body extract (FBE) or were untreated (Control) for 8 h. Control (Red), FBE (Green), rOly (Black). Results are representative of one out of two independent experiments performed in triplicate. Data were obtained from 15,000 HCT116 cells.
