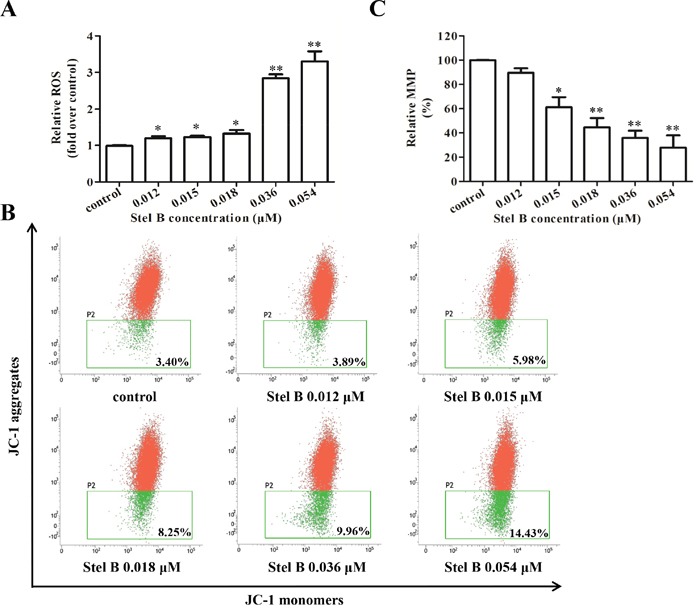
Figure 5. Effect of Stel B on the ROS generation and MMP in K562 cells.

(A) Flow cytometric determination of ROS generation in K562 cells with or without Stel B treatment. Cells were treated with indicated concentrations of Stel B for 48 h, followed by DCFH-DA staining for 30 min. The ROS levels were determined by flow cytometer. Data represent mean ± SD of three independent experiments. *: p < 0.05, *: p < 0.01, compared with control. (B) Effect of Stel B on MMP in K562 cells with or without Stel B treatment. Cells were exposed to various concentrations of Stel B for 24 h. MMP (ΔΨm) was measured by the uptake of JC-1 using flow cytometer. Cells containing JC-1 monomers (green) indicate low ΔΨm while those containing JC-1 aggregates (red) indicate high ΔΨm. (C) Quantification of the MMP (% control) in K562 cells with or without Stel B treatment. MMP was calculated as the ratio of the red fluorescence to green fluorescence. Relative MMP represents the MMP of the respective sample over that of control (%). Data represent mean ± SD of three independent experiments. *: p < 0.05, *: p < 0.01, compared with control.
