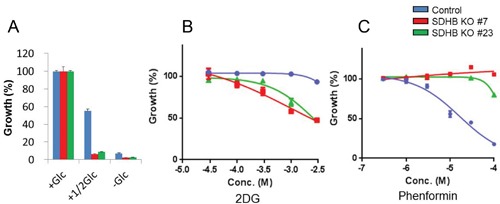
Figure 3. Growth of SDHB knockout cells dependent on glycolysis.

(A) Growth rate of SDHB knockout cells and control cells cultured under conditions of regular glucose concentration (2 g/L), half glucose concentration (1 g/L), and glucose deprivation (0 g/L). (B, C) SDHB knockout cells and control cells were exposed to 2DG and phenformin. After 4 days, cell viability was assessed. Ordinate values were obtained by setting the control group value as 100%. Data are given as means ± SD (n = 3).
