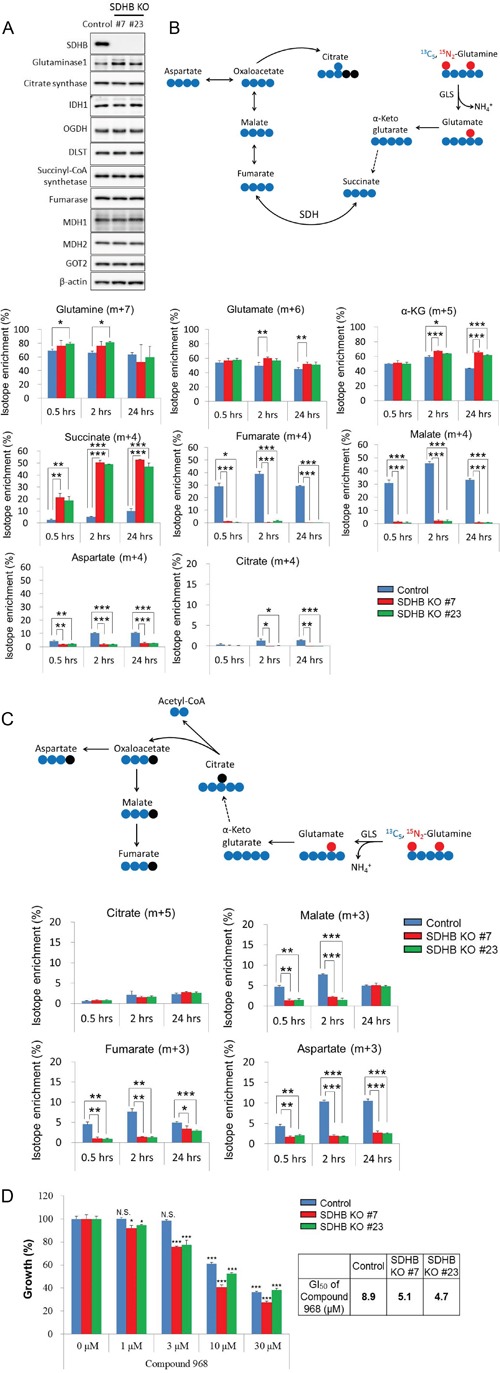
Figure 5. Growth of SDHB knockout cells dependent on glutaminolysis.

(A) Cells were lysed 64 h after seeding, and expression levels of SDHB, glutaminase 1, citrate synthetase, IDH1, OGDH, DLST, succinyl-CoA, fumarase, MDH1, MDH2, GOT2, and β-actin were determined by western blotting. (B) The schematic illustration shows 13C5, 15N2-glutamine-derived oxidative glutaminolysis. The blue and red symbols (●, ●) represent 13C atoms and the black symbols (●) represent 12C atoms. Incorporation of 13C5, 15N2-glutamine into glutamate, α-ketoglutarate, succinate, fumarate, malate, aspartate, and citrate by oxidative glutaminolysis in SDHB knockout cells and control cells is shown as isotope enrichment of total metabolites. Data are given as means ± SD. *P < 0.05, **P < 0.01, ***P < 0.001 by the Bonferroni's corrected t-test. (C) The diagram represents 13C5, 15N2-glutamine-derived reductive carboxylation. The blue and red symbols (●, ●) represent 13C atoms and the black symbols (●) represent 12C atoms. Incorporation of 13C5, 15N2-glutamine into citrate, malate, fumarate, and aspartate by reductive carboxylation in SDHB knockout cells and control cells is shown as isotope enrichment of total metabolites. Data are given as means ± SD. *P < 0.05, **P < 0.01, ***P < 0.001 by the Bonferroni's corrected t-test. (D) SDHB knockout cells and control cells were treated with the indicated concentrations of the glutaminase 1 inhibitor Compound 968. After 4 days, cell viability was assessed. Ordinate values were obtained by setting the vehicle control value as 100%. Data are given as means ± SD (n = 3). Growth inhibition of 50% (GI50) was calculated using GraphPad Prism version 6 software. N.S., not significant. *P < 0.025, **P < 0.005, ***P < 0.0005 by Williams’ test.
