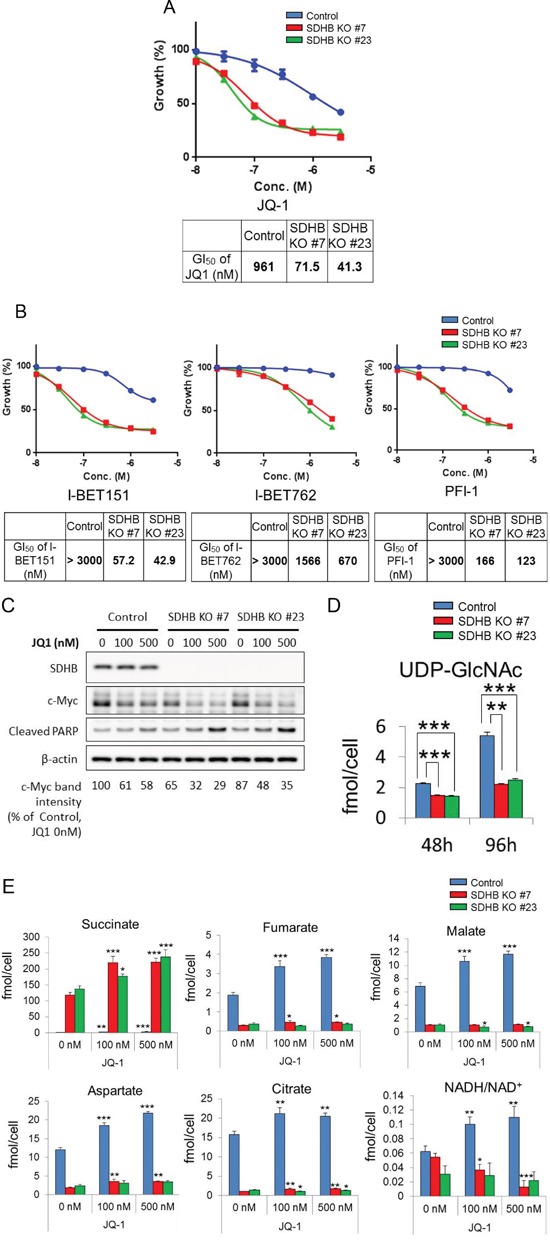
Figure 6. Specific growth inhibition of SDHB-deficient cells by BET inhibition.

(A, C) SDHB knockout cells and control cells were treated with the indicated concentrations of the BET inhibitors JQ-1, I-BET151, I-BET762, and PFI-1. After 4 days, cell viability was assessed. Ordinate values were obtained by setting the vehicle control value as 100%. Data are given as means ± SD (n = 3). Growth inhibition of 50% (GI50) was calculated using GraphPad Prism version 6 software. (B) Cells were treated with JQ-1 for 38 h and lysed to detect expression levels of SDHB, c-Myc, cleaved PARP, and β-actin by western blotting. (D) Metabolite concentrations of UDP-GlcNAc 48 and 96 h after seeding were assessed using CE-MS (n = 3). Data are given as means ± SD. *P < 0.05, **P < 0.01, ***P < 0.001 by the Bonferroni's corrected t-test. (E) SDHB knockout cells and control cells were treated with JQ-1. After 48 h, metabolite concentrations of succinate, fumarate, malate, aspartate, citrate, and NADH/NAD+ were assessed using CE-MS (n = 3). Data are presented as means ± SD; N.S., not significant, *P < 0.025, **P < 0.005, ***P < 0.0005 by Williams’ test.
