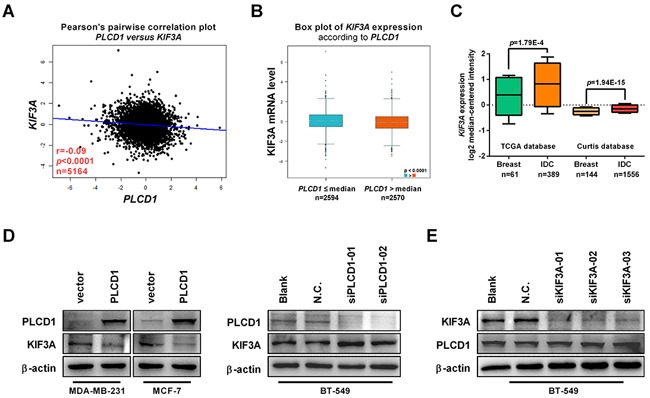
Figure 5. PLCD1 suppresses KIF3A in breast cancer.

(A) Correlation between the expression of PLCD1 and KIF3A in breast cancer analyzed by Breast Cancer Gene-Expression Miner v4.0 (bc-GenExMiner v4.0) (r = −0.09, p<0.0001, n = 5164). (B) Expression of KIF3A in cells expressing high (PLCD1>median) and low (PLCD1≤median) amounts of PLCD1 (p<0.0001). (C) Expression of KIF3A (log2 median-centered intensity) in normal breast tissues and invasive ductal carcinomas (IDC) analyzed using the Oncomine microarray database, the Cancer Genome Atlas (TCGA) and the Curtis microarray database. (D) PLCD1-expressing cells and vector-only control cells (MDA-MB-231, MCF-7) and BT-549 cells transfected with siN.C. and siPLCD1 for 72 h. KIF3A protein levels were measured by immunoblotting with β-actin as an internal control. Data were based on at least three independent assays, and representative images were shown. (E) BT-549 cells transfected with siN.C. and siKIF3A for 72 h. KIF3A and PLCD1 protein levels were measured by immunoblotting with β-actin as an internal control. Data were based on at least three independent assays, and representative images were shown.
