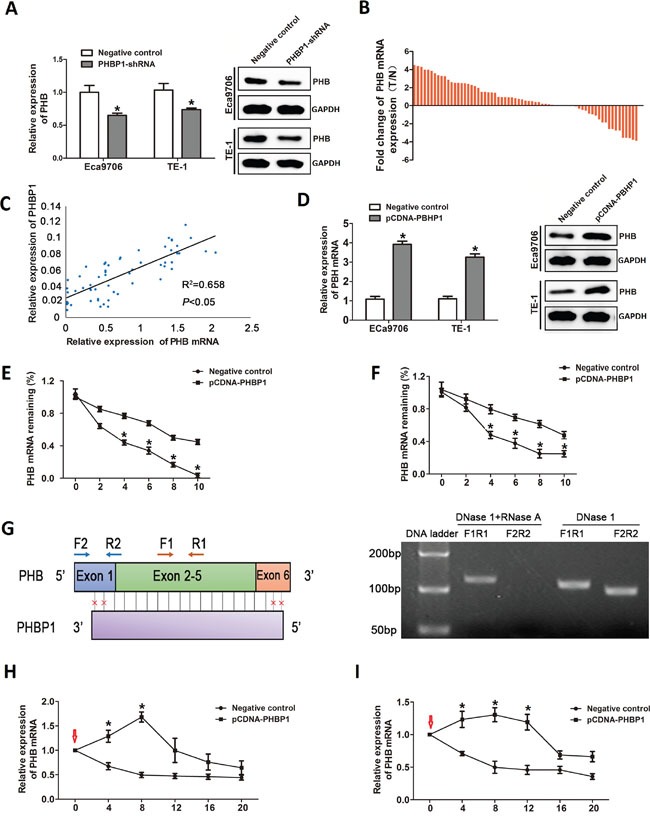
Figure 3. The regulatory effect of PHBP1 on PHB expression.

(A) The PHB mRNA levels (left) and protein levels (right) in both Eca9706 and TE-1 cells after PHBP1 knockdown by qRT-PCR analysis and western blot analysis. (B) The expression of PHB was measured by qRT-PCR in ESCC tissues and adjacent noncancerous tissues and normalized to GAPDH. Statistical differences between groups were performed using the two-tailed Student's t-test (P<0.05). (C) PHBP1 and PHB expression levels were positively correlated in ESCC tissues (R2= 0.658, P<0.05 by Pearson correlation test). (D) The PHB mRNA levels (left) and protein levels (right) in both Eca9706 and TE-1 cells transfected with pCDNA-PHBP1 or negative control. The PHB mRNA half-life by incubating Eca9706 cells (E) and TE-1 (F) transfected with pCDNA-PHBP1 or negative control with actinomycin D using qRT-PCR. (G) PHBP1transcript overlaps with 90% nucleotides of PHB mRNA indicated by vertical black lines (left). The blocks with colors indicate exons; Primer sites (F1: forward primer 1 and R1: reverse primer 1) in PHB mRNA represents the non-overlapping region between PHBP1 and PHB transcripts, and primer sites (F2: forward primer 2 and R2: reverse primer 2) indicates the overlapping region between PHBP1 and PHB transcripts. RT-PCR data depicted the detection of PHBP1 formed RNA duplex with PHB mRNA that protected PHB mRNA from RNase degradation (right) which digested the single-stranded RNA. PCR products were amplified using F1R1 and F2R2. The stability of PHB mRNA was examined by incubating Eca9706 cells (H) and TE-1 (I) transfected PHBP1 after 24h with α-amanitin (30mM) for 4, 8,12,16 and 24h compared with cells transfected with an empty vector; the red arrows indicated the time of α-amanitin added into the medium. Data are presented as mean±SD based on at least three independent experiments. *P<0.05, compared with negative control. Statistical analyses were performed using One-way ANOVA or two-tailed Student's t-test.
