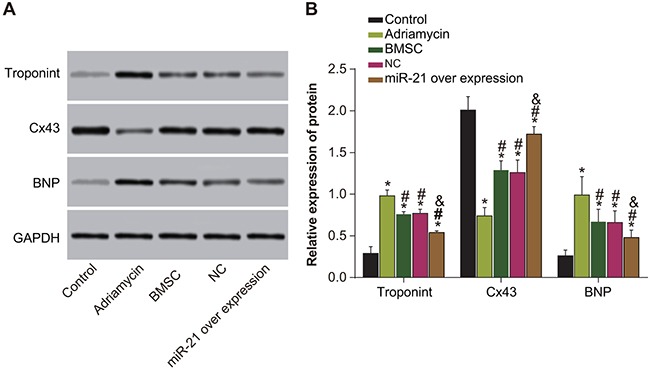
Figure 8. Expressions of Cx43, troponin T and BNP among five groups of rats (negative control, adriamycin treatment only, BMSC, pLVX-BMSC and pLVX-miR-21-BMSC).

(A) Expression of Cx43, troponin T and BNP detected by Western blotting; (B) Relative expression of Cx43, troponin T and BNP and comparison between groups. Note: * denotes P < 0.05, compared with the control group; #, P < 0.05, compared with the adriamycin treatment only group; & denotes P < 0.05, compared with the BMSCs and the pLVX-BMSC group.
