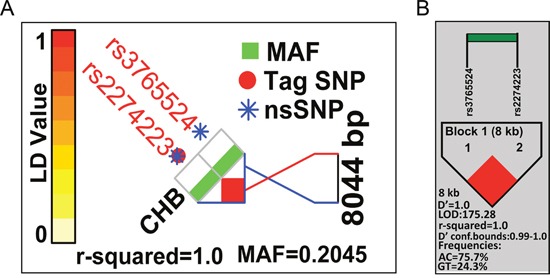
Figure 1. Patterns of LD plots for two selected SNPs in the PLCE1 gene.

(A) Pattern of LD plot and pairwise LD (r2) value calculated based on HapMap data of CHB samples. (B) Pattern of LD plot and pairwise LD (r2) value calculated based on data from the current study of HBV-related HCC cases.
