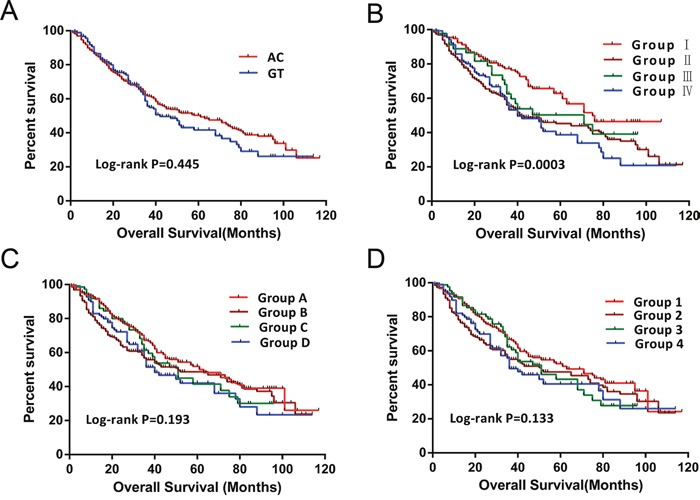
Figure 3. Survival curves of patients with different PLCE1 haplotypes and joint-effects analysis of different AFP levels.

(A) OS stratified by AC and GT haplotypes. (B–D) OS stratified by joint-effects analysis of PLCE1 haplotypes and an AFP cut-off level of 20 ng/ml (B), 200 ng/ml (C), and 400 ng/ml (D).
