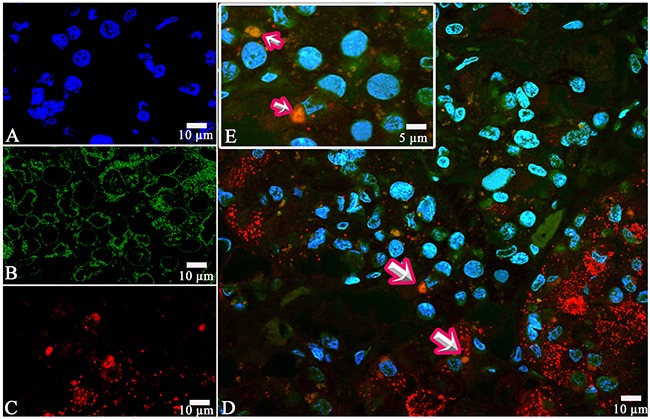
Figure 13. Laser Confocal Scanning Microscopy of the normal anterior pituitary.

(A) Blue fluorescence of cell nuclei (DAPI). (B) Green fluorescence of Growth hormone. (C) Red fluorescence of Adrenocorticotropic hormone. (D, E) Hormone co-expression is visualized with yellow/orange colour (arrows). A, B, C, D x400. E Zoom.
