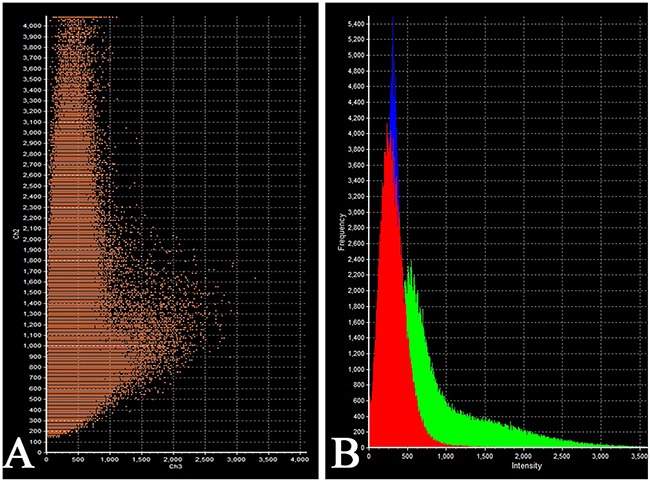
Figure 9. Laser Confocal Scanning Microscopy of the normal anterior pituitary.

(A) Scatterplot of red (Follicle-stimulating hormone) and green (Prolactin) pixel intensities of pituitary cells. (B) Intensity Histogram of red (Follicle-stimulating hormone), green (Prolactin) and blue (DAPI) fluorescence.
