
Figure 2. Combinatorial Z-LIG and TAM induced cell apoptosis.
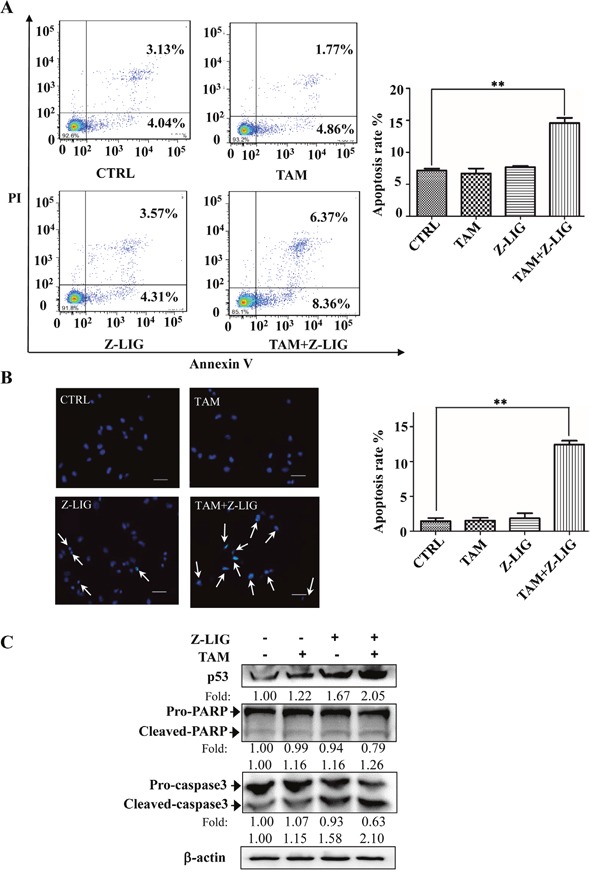
MDA-MB-231 cells were treated with Z-LIG (50 μM) and TAM (5 μM) alone or their combination for 72 h. (A) Apoptotic cells were quantified by flow cytometry after stained with FITC-conjugated Annexin V and PI. (B) Morphologic change of apoptotic cells was evaluated by Hoechst 33342 staining. The scar bar is 50 μm. (C) The expression of apoptosis-related proteins as indicated were determined by Western blotting. β-actin was used as an internal control. The blots were a representative of three independent experiments. Values represent mean ± SD. *p< 0.05, **p< 0.01 compared with control.