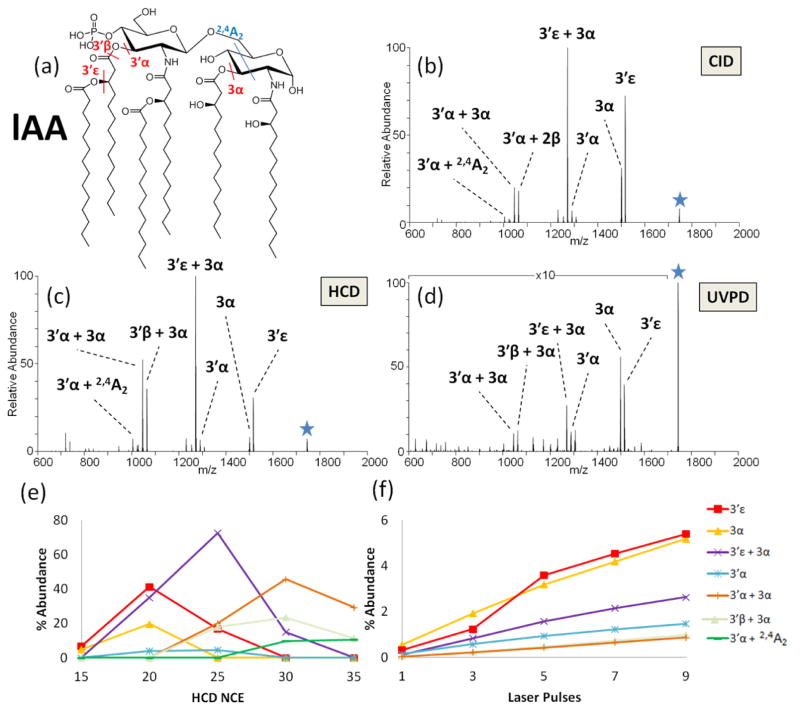
Figure 1.
(a) Structure of lAA and the corresponding MS/MS spectra of the deprotonated lipid by: (b) CID at NCE 35, (c) HCD at NCE 25, and (d) UVPD at 2.5 mJ for seven pulses. Only the most prominent fragment ions are labeled. ERMS plots are shown in (e) HCD and (f) UVPD. The HCD ERMS plot is shown with error bars in Figure S3 to illustrate the typical standard deviations of these measurements.

