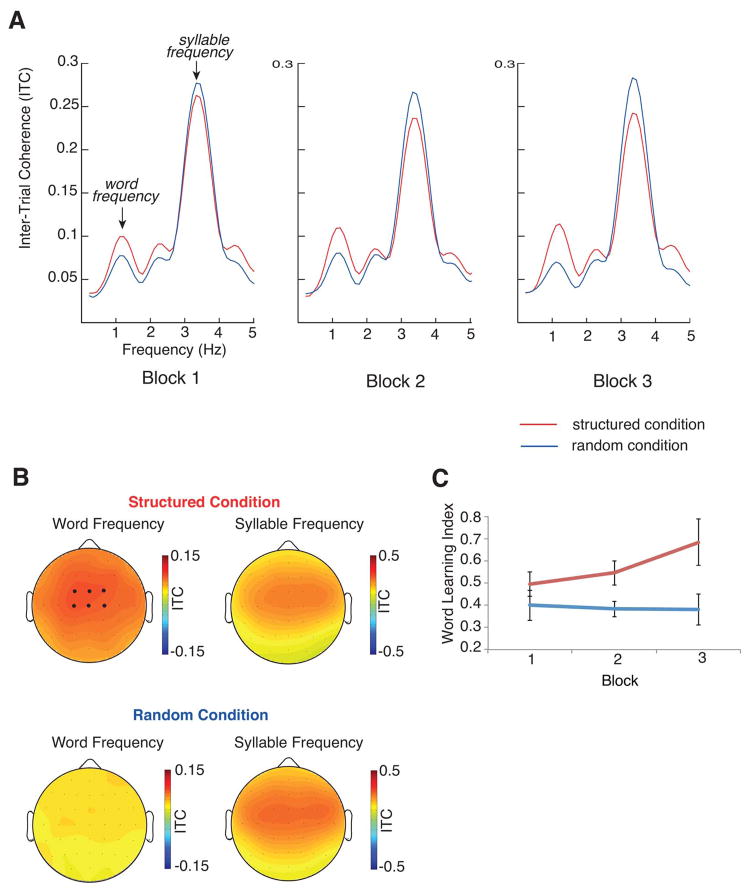
Figure 4.
EEG results. (A) ITC as a function of condition (structured, random), block (1–3), and frequency. ITC values were used to compute the WLI, as described in Methods. (B) Topographical plots showing distribution of ITC across the scalp, as a function of condition and frequency (word, syllable). Note that different scales are used for word versus syllable frequencies. The six darker dots on the upper left scalp plot denote the approximate locations of the six centro-frontal electrodes used for WLI computations, where ITC was generally maximal at both the word and syllable frequencies. (C) The WLI as a function of condition and block.

