
Figure 6.
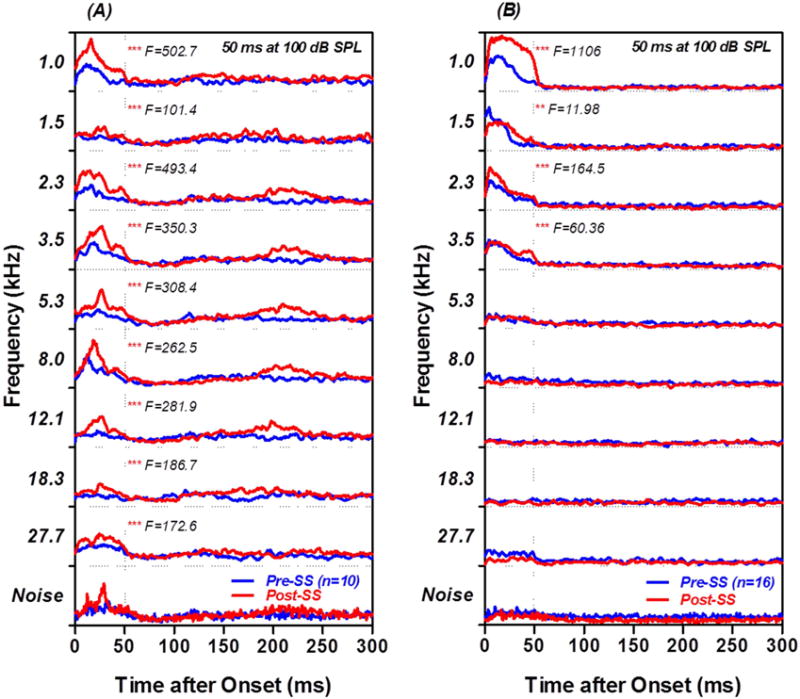
Tone evoked PSTHs from PFL MUC. (A) Mean PSTHs evoked by 100 dB, 50 ms tone bursts (top 9 rows) from the 10 MUC that responded to noise-burst with long latency (bottom row). Tone bursts from 1–8 kHz evoked distinct PSTH responses pre-SS (blue line); the peak response in the PSTH occurred 15–20 ms after stimulus onset. PSTH response amplitudes were significantly larger 2 h post-SS than before treatment (F values shown in each panel). (B) Mean tone burst evoked PSTH from 16 MUC that responded weakly or not at all to noise bursts. Tone bursts mainly evoked responses from 1–3.5 kHz prior to the SS treatment. PSTH response amplitudes in the 1–3.5 kHz range increased significantly 2 h post-SS (F values shown in figure). ** p<0.01, *** p<0.001.