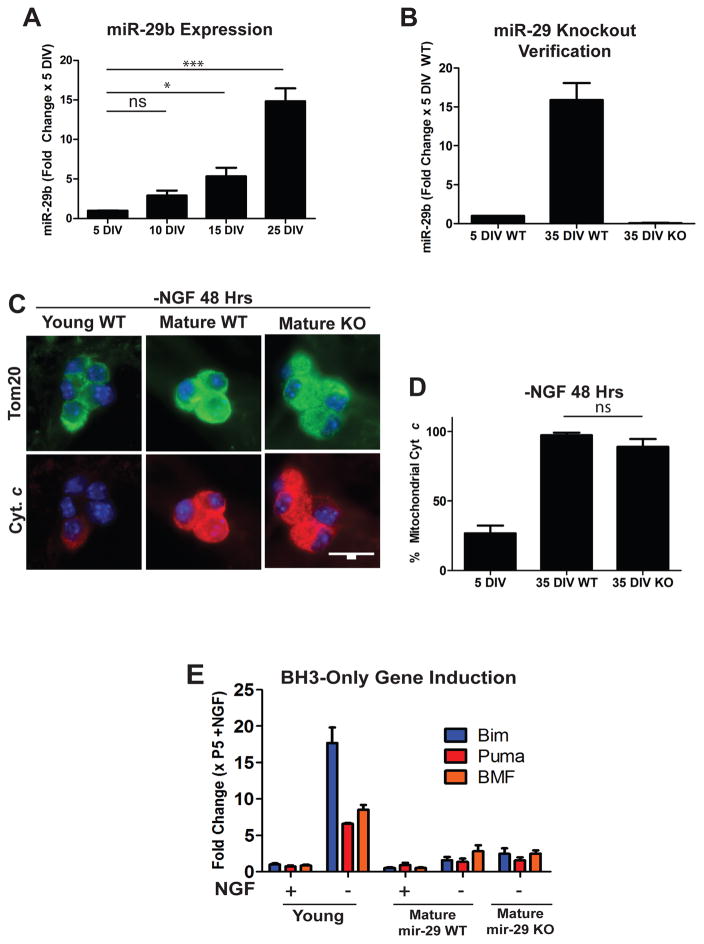
Figure 2.
Mature miR-29 deficient neurons remain resistant to NGF-deprivation induced cyt c release. A) Timecourse of miR-29b induction in maturing neurons. Neurons were isolated from neonatal mice and cultured for the indicated amount of time and miR-29 levels were assessed by RT-qPCR. Values are expressed as mean fold change ± SEM relative to 5 DIV neurons from 3 independent experiments (**=p<0.01, ***=p<0.001, ns=not significant). B) Verification of miR-29 deficiency in mature mir-29 knockout neurons as assessed by RT-qPCR. Values are expressed as mean fold change ± SEM relative to WT 5 DIV neurons from 3 independent experiments. C) Representative images of cyt c staining in mature WT and miR-29 KO cells deprived of NGF for 48 hours. D) Quantification of cyt c release in young WT neurons and mature WT and mature miR-29 KO neurons deprived of NGF for 48 hours. Data represent the percentage of cells with mitochondrial cyt c and are presented as mean ± SEM of 3 independent experiments. E) RT-qPCR quantification of selected BH3-only genes in young, mature WT, and mature miR-29 KO neurons deprived of NGF for 48 hours. Fold changes were normalized to P5 +NGF neurons and represent mean ± SEM of 3 independent experiments.

