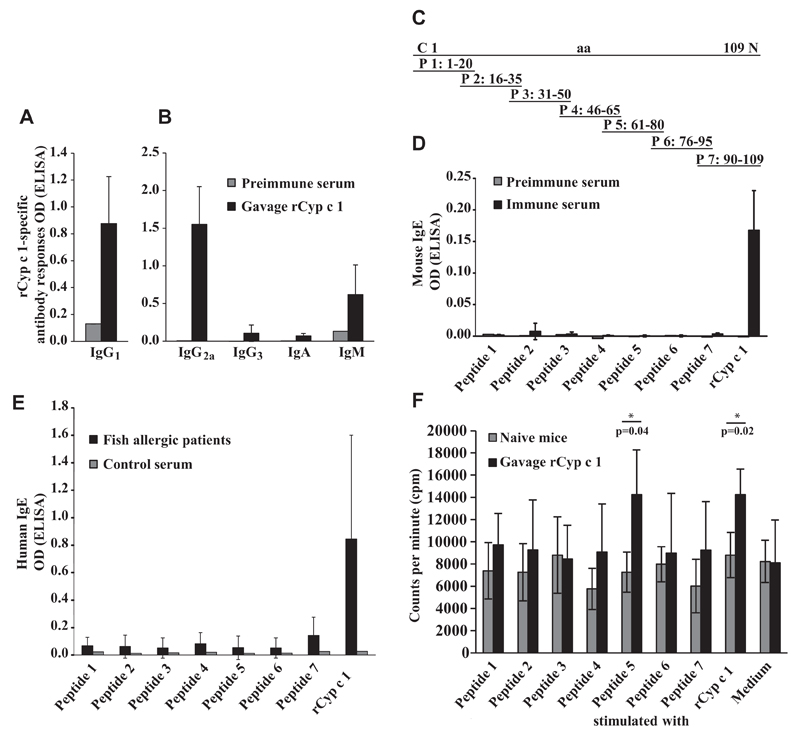
Fig 2.
Cyp c 1–specific immune responses in rCyp c 1-sensitized mice. A and B, Induction of Cyp c 1–specific IgG1 and IgG2a, IgG3, IgA, and IgM as measured by ELISA. C, Position of synthetic Cyp c 1–derived peptides 1 to 7 in the Cyp c 1 molecule. aa, Amino acids. D and E, Epitope mapping of mouse IgE and allergic patients’ IgE with Cyp c 1 peptides. Shown are mean antibody levels (y-axes: OD values ± SDs). F, Proliferation of splenocytes from Cyp c 1–sensitized and naive mice in response to Cyp c 1 peptides, rCyp c 1, and medium alone. Results are displayed as mean counts per minute ± SDs for the 2 mouse groups. Asterisks (*) indicate significant differences (P < .05) between mouse groups.

