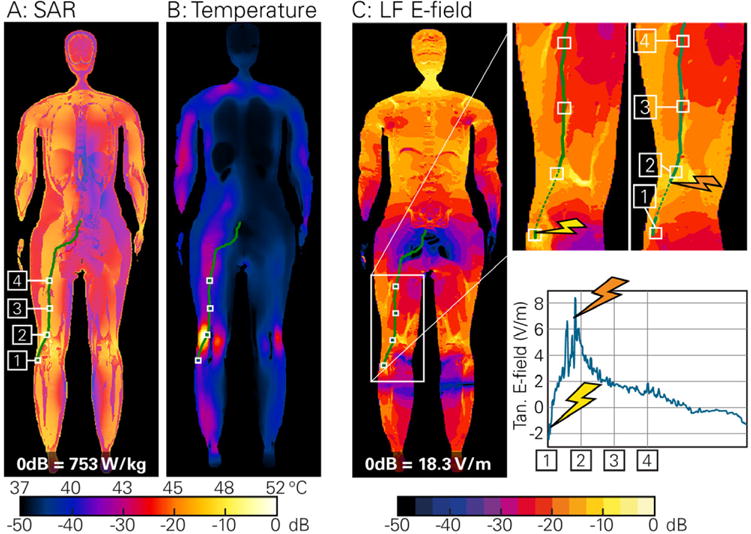
Figure 4.

Simulation results showing the local SAR distribution in dB (10 × log()) (A), the RF induced heating (B), and the LF E-field in dB (20 × log()) (C). (C) includes enlarged field distributions near stimulation locations and a plot of the tangential E-field along the nerve.
