Figure 2.

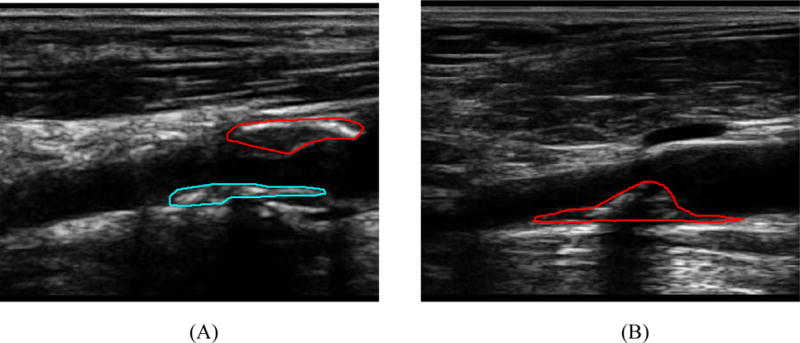
B-mode images at peak-systole for 2 patients: (a) patient with 2 plaque regions on the near and far arterial walls, (b) patient with a single plaque region on the far wall. Red and blue lines indicate manually outlined plaque regions.

B-mode images at peak-systole for 2 patients: (a) patient with 2 plaque regions on the near and far arterial walls, (b) patient with a single plaque region on the far wall. Red and blue lines indicate manually outlined plaque regions.