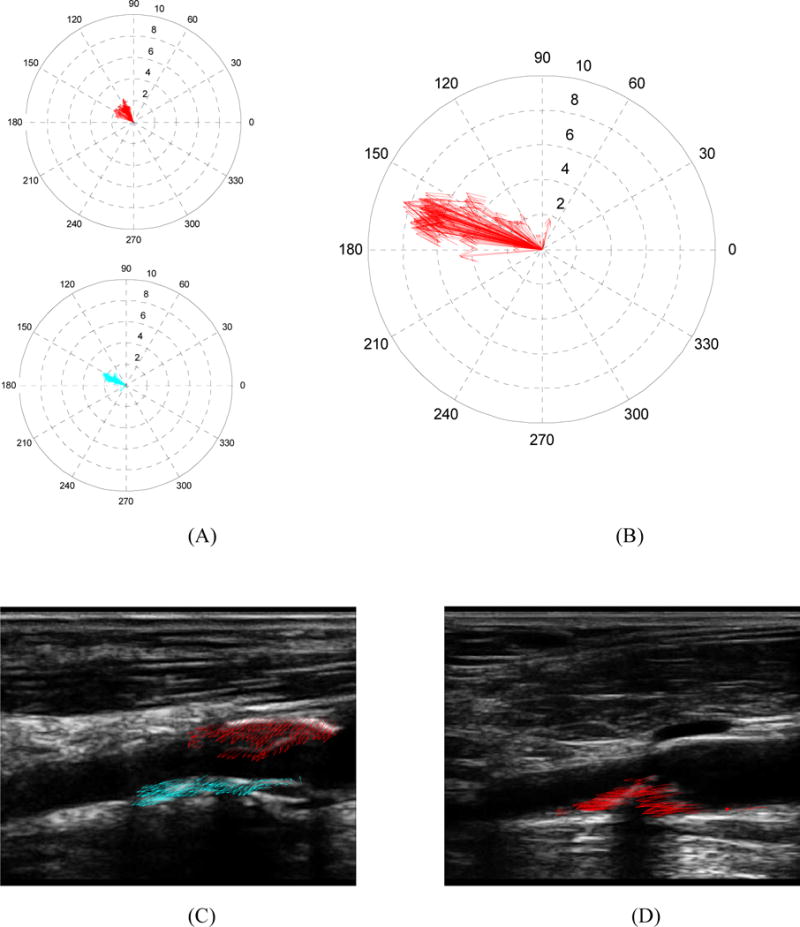
Figure 3.

Speckle tracking-based displacement fields: (a–b) Compass plots representing displacement fields for the plaque regions in (a) the patient of Figure 1 (a), and (b) the patient of Figure 1(b). The length of the arrows represents displacement magnitude and their angle represents angular orientation of displacement. (c–d) Quiver plots showing the displacement vectors superimposed on B-mode images of the plaque regions.
