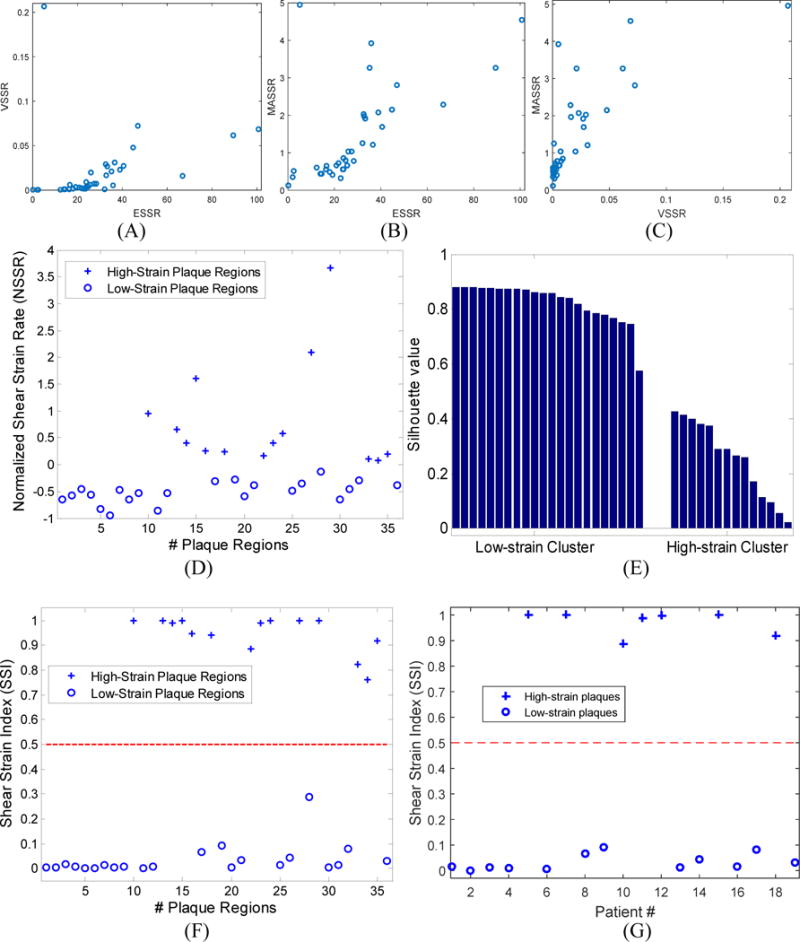
Figure 5.

Cluster-attribution into high or low-strain for 36 plaque regions in 19 patients: (a)–(c) 2D-strain feature scatter plots based on magnitude (Maximum Absolute Shear Strain Rate, MASSR) and spread (Variance Of Shear Strain Rate, VSSR and Entropy Of Shear Strain Rate, ESSR) of strain measurements, (d) Normalized Shear Strain (NSSR) Rate-based k-means classification, (e) Silhouette plots indicating the significance of the k-means classification shown in (d), (f) Plaque and (g) Patient-wise Shear Strain Indices (SSI) with the dashed red lines indicating the decision-boundary between high and low strain. ‘+’ and ‘o’ in (d), (f) and (g) indicate high-strain and low-strain cluster-assignments respectively.
