
Fig 3.
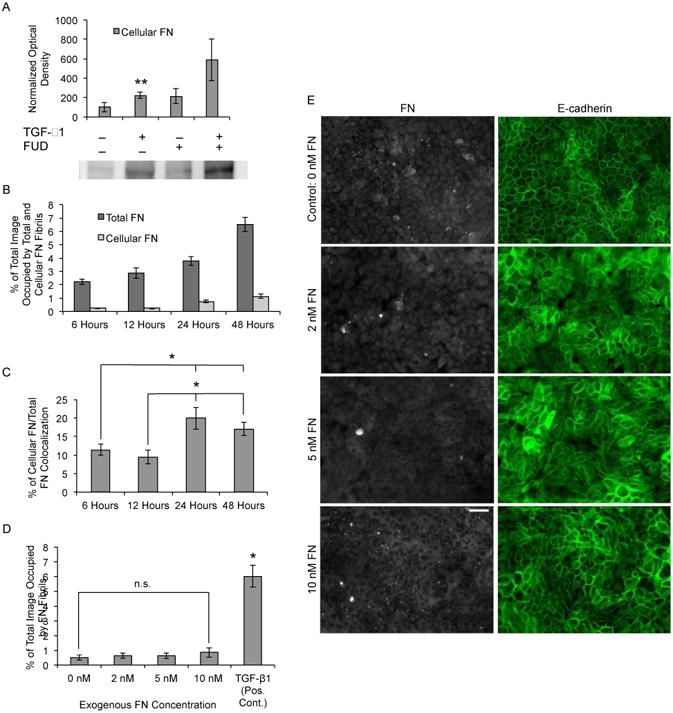
Increased exposure to soluble FN is insufficient to drive EMT. (A) MCF10As were treated with TGF-β1 and/or FUD for 48 hours and whole-cell lysates (15-30 μg total protein) were probed by Western blotting for expression of cellular FN. Band optical density was quantified and normalized to total lane protein. Data is presented as percentage of negative control optical density. Two way ANOVA (+/- FUD, +/- TGF-β1), N ≥ 12 for each condition. **p ≤ 0.05 significantly different for effect of TGF-β1. (B) Quantification of cellular FN fibril area and total FN fibril area per image over time. N ≥ 12 for each condition. (C) Quantification of percentage of overlap between cellular FN fibrils and total FN fibrils. N ≥ 12 for each condition. *p ≤ 0.01 significantly different from 6 hours or 12 hours, Student's t-test. (D) Quantification of percent of total image area occupied by FN fibrils for MCF10As cultured with increasing concentrations of exogenous FN. n.s., not significant; one way ANOVA, N ≥ 5 for each condition. *p ≤ 0.01 significantly different from TGF-β1, Student's t-test. (E) Immunofluorescence images of MCF10As cultured with increasing concentrations of soluble FN for 48 hours. Ab staining for FN (white), and E-cadherin (green). Scale bar is 50 μm.