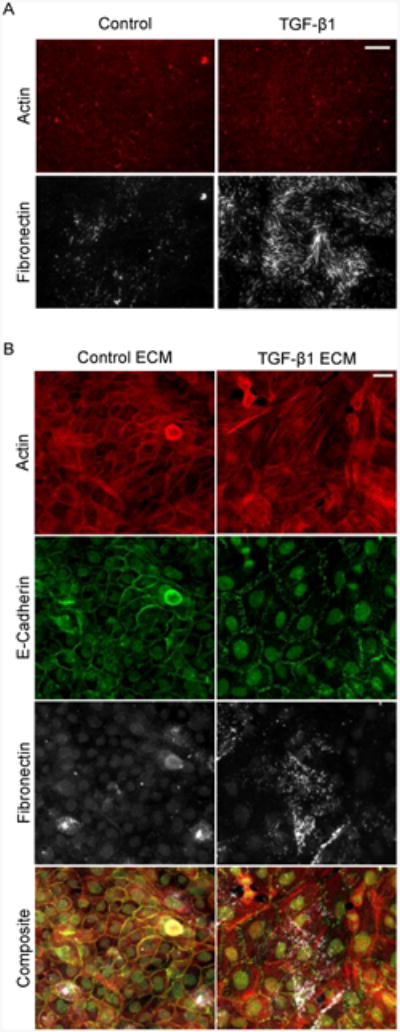
Fig 8.

MCF10As on cell-extracted ECM. (A) Representative immunofluorescence images of the resulting MCF10A matrix after treatment with or without TGF-β1 for 48 hours. (B) Representative immunofluorescence images of MCF10As cultured on pre-assembled ECM from cells treated with or without TGF-β1 for 48 hours and cultured for an additional 24 hours. Ab staining for F-actin (red), E-cadherin (green), and FN (white). Scale bar is 20 μm.
