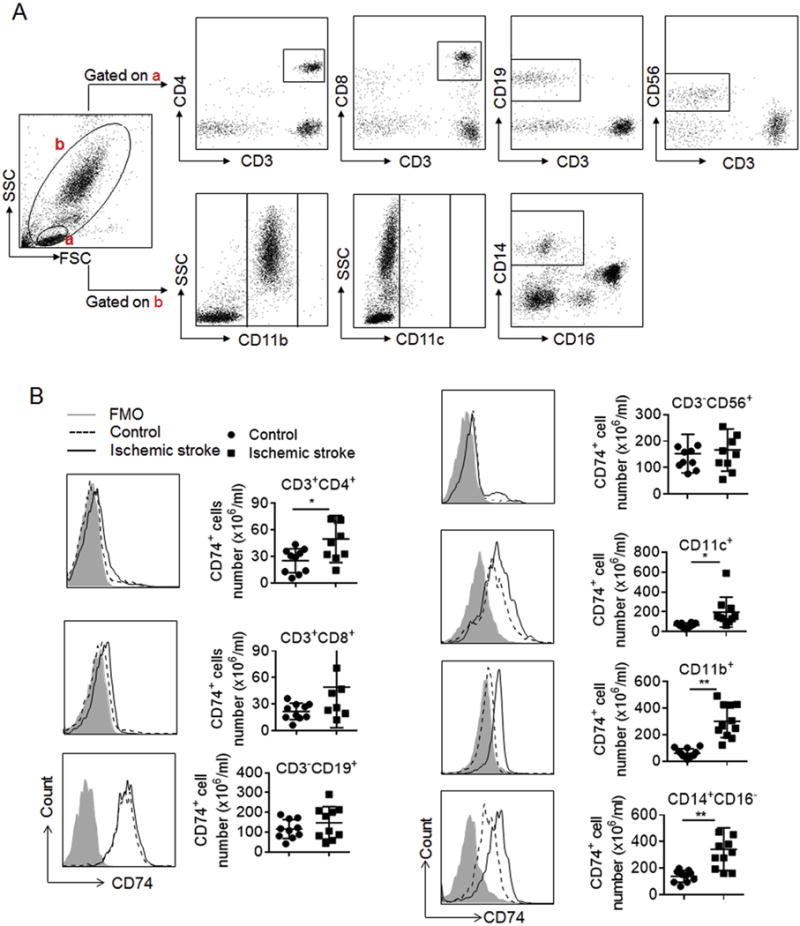
Fig. 2. Expression profile of CD74 in PBMC subsets after brain ischemia.

PBMC were obtained from subjects with ischemic stroke (<72 h after onset) and HC. The numbers of CD74-expressing cells were measured by flow cytometry. A. Representative flow cytometry plots show gating strategy of CD74-expressing cell subsets in PBMC, including CD4+ T cells (CD3+CD4+), CD8+ T cells (CD3+CD8+), B cells (CD3−CD19+), NK cells (CD3−CD56+), CD11b+ cells, CD11c+ cells and monocytes (CD14+CD16−). B. Flow cytometry histogram and summarized results show significant increase of CD74 expression in CD4+ T, CD11b+ & CD11c+ cells and monocytes. CD4+ T cells (HC: n = 10; Stroke: n = 9); CD8+ T cells (HC: n = 10; Stroke: n = 8); B cells (HC: n = 10; Stroke: n = 10); NK cells (HC: n = 10; Stroke: n = 10); CD11c+ cells (HC: n = 10; Stroke: n = 10); CD11b+ cells (HC: n = 12; Stroke: n = 11); and monocytes (HC: n = 10; Stroke: n = 11). Data are presented as mean ± s.e.m. *P < 0.05, **P < 0.01.
