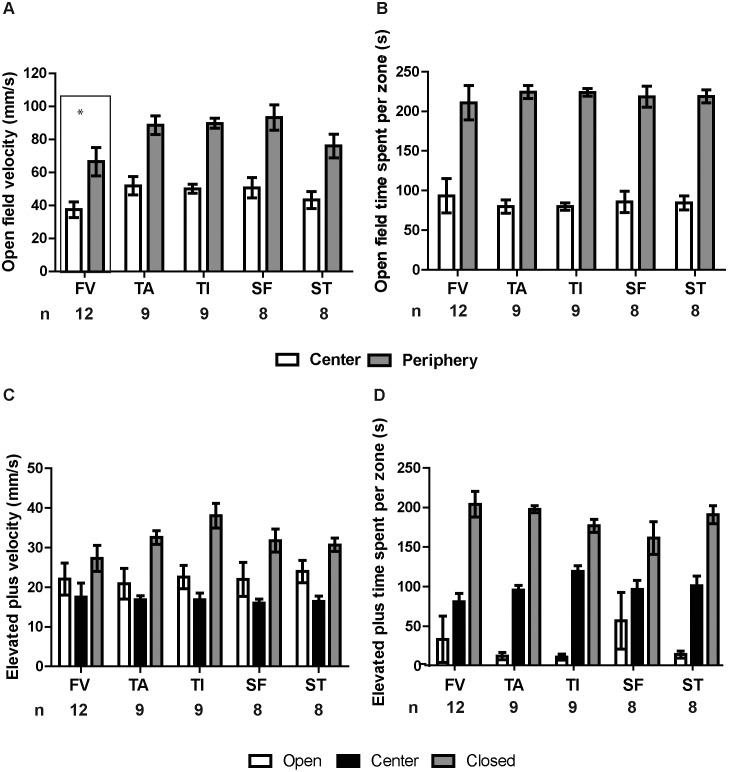
Figure 5.
The FV group exhibited a significantly lower average speed in the open field test relative to all other groups. Mice were placed into an open field arena for 5 min, during which their movements were recorded and analyzed with CleverSys TopScan software. (A) Velocity and (B) time spent in the center and peripheral zones were analyzed. (A) Region (center compared with periphery, P < 0.001) and treatment (P = 0.003) had significant effects on velocity; mice moved more slowly in the center than along the periphery. Between phlebotomy groups, the FV group exhibited a significantly lower velocity overall (regardless of zone) than any of the other phlebotomy groups (P < 0.05 for all) except ST (P > 0.05); there were no other significant pairwise differences between groups. (B) Mice spent more time along the periphery (P < 0.001) than in the center of the open field, but treatment had no effect on the times spent in either region (P = 0.862). After the open field test, mice were placed into the observation cage for 5 min, then placed in an elevated plus maze for 5 min. Maze zone significantly influenced (C) mean velocity and (D) the time spent in each zone (P < 0.001), but phlebotomy group did not affect performance in the elevated plus maze (P > 0.05). Error bars represent SEM.

