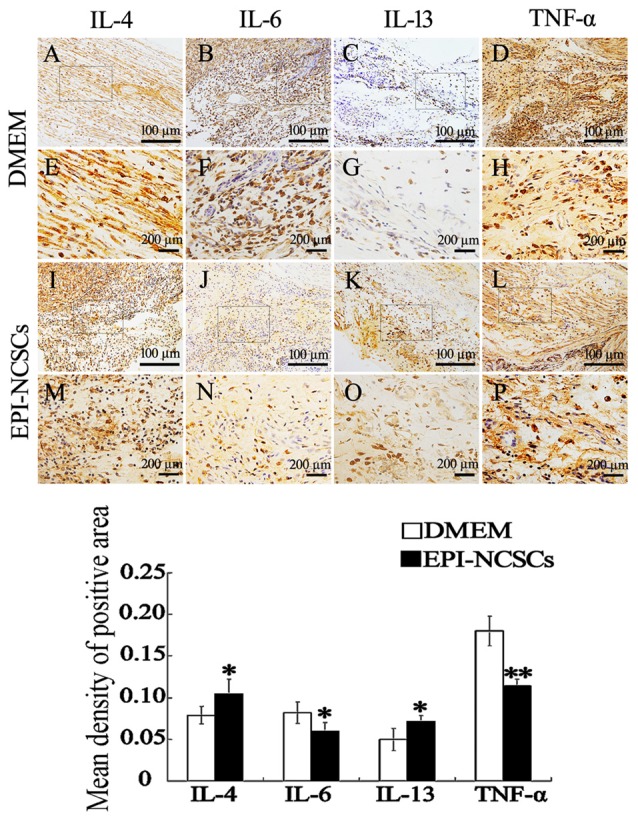
Figure 4.

Immunohistochemical staining of inflammatory cytokines in the nerve stump at 7 days after bridging. (E–H, M–P) were enlarger of frames in (A–D, I–L). *Values are significantly different at P < 0.05, compared with DMEM group; **Values are significantly different at P < 0.01, compared with DMEM group. (A–D, I–L), scale bar = 100 μm. (E–H, M–P), scale bar = 200 μm.
