Figure 6.

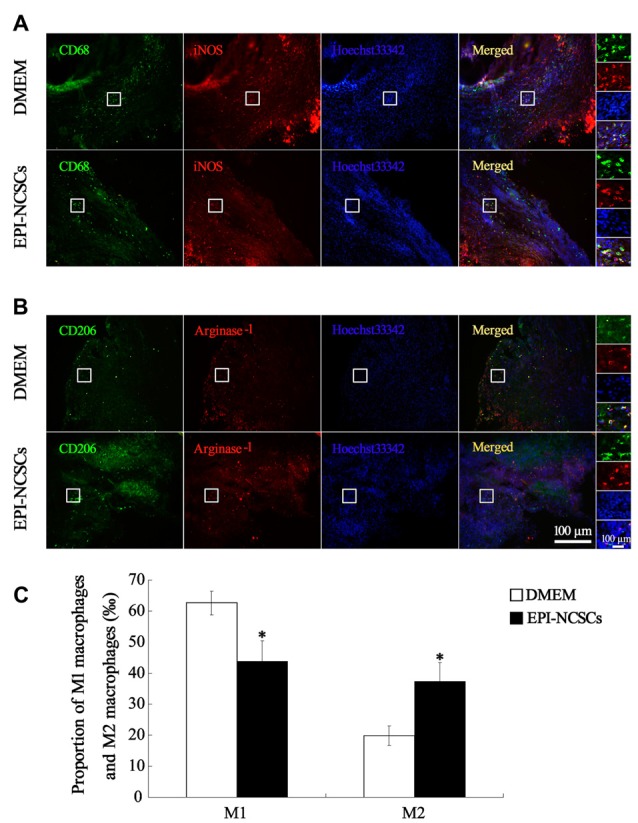
Immunofluorescence staining showed M1 macrophages marked by CD68 and iNOS (A) and M2 macrophages marked by CD206 and Arginase-1 (B) at 7 days after bridging (C) was the proportion of M1 macrophages and M2 macrophages. Scale bar = 100 μm.

Immunofluorescence staining showed M1 macrophages marked by CD68 and iNOS (A) and M2 macrophages marked by CD206 and Arginase-1 (B) at 7 days after bridging (C) was the proportion of M1 macrophages and M2 macrophages. Scale bar = 100 μm.