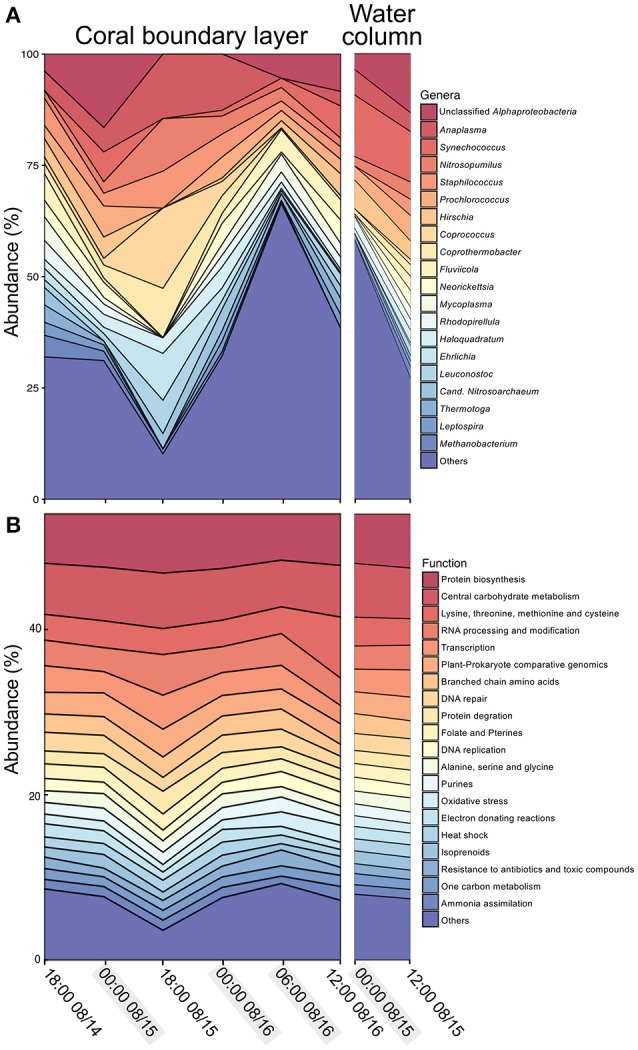
Figure 2.

Taxonomic and functional profiles. Abundance of (A) dominant genera as assigned by FOCUS in the coral boundary layer (left panel) and water column (right panel), and (B) dominant level 2 Subsystem functions in SEED database as assigned by SUPERFOCUS the coral boundary layer (left panel) and water column (right panel). Shadowed time points indicate samples grouped as “night.”
