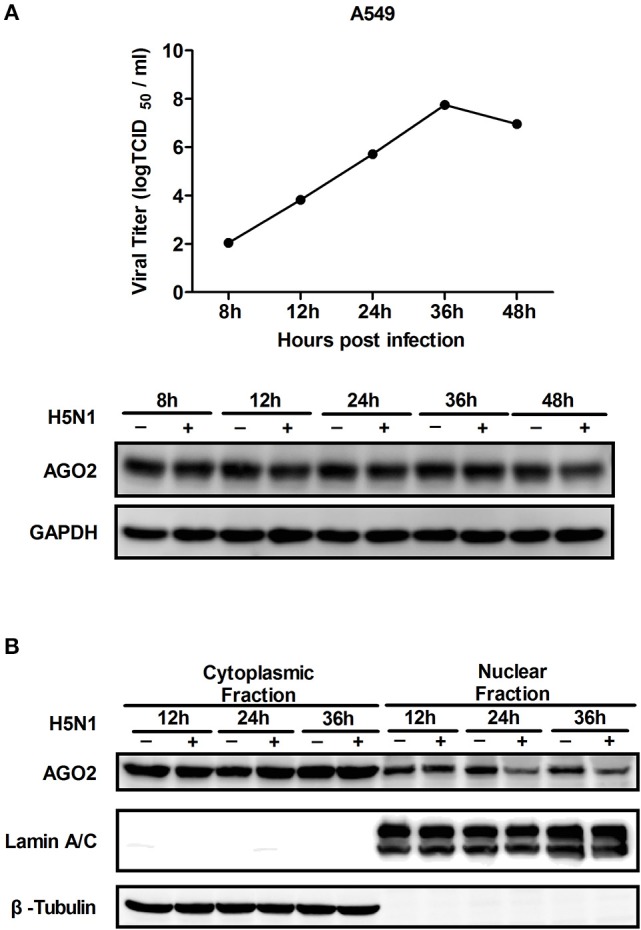
Figure 2.

Expression and distribution of AGO2 in cells. (A) A549 cells were infected with H5N1. Kinetics of virus infection and protein levels of AGO2 were detected at different time points. (B) A549 cells were infected with H5N1. At different time points, cells were harvested, subcellular fractionation was performed, and AGO2 in cells was detected by Western blot.
