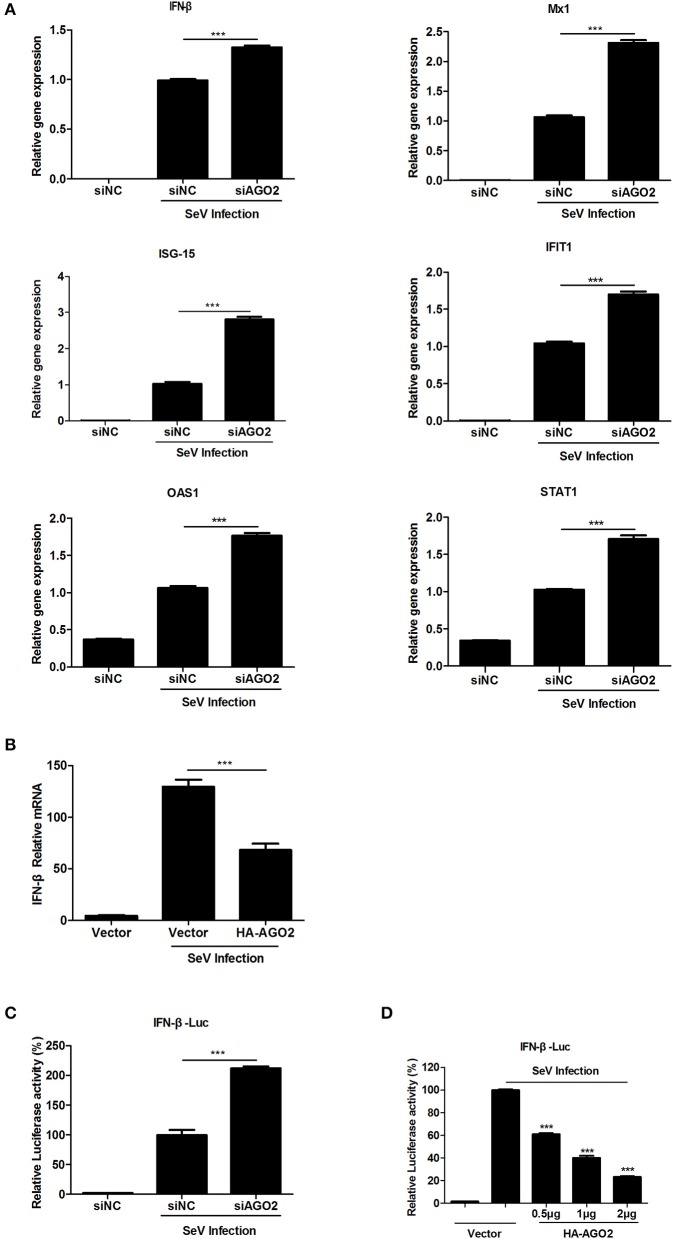
Figure 3.
AGO2 inhibits SeV induced IFN-β activation. (A) A549 cells were transfected with siNC and siAGO2. After 48 h, the cells were stimulated with SeV, and RNA expression levels of the ISGs and IFN-β were compared. Data are presented as means ± SD from three independent experiments. (B) A549 cells were transfected with HA-AGO2 and an empty vector. After 48 h, the cells were stimulated with SeV, and the RNA expression levels of IFN-β were examined. Data are presented as means ± SD from three independent experiments. (C) HEK293T cells were cotransfected with siNC/siAGO2, IFN-β-Luc, and pGL4.75 (hRluc/CMV). After 48 h, the cells were stimulated with SeV, and luciferase reporter assay was performed. Data are presented as means ± SD from three independent experiments. (D) HEK293T cells were transfected with IFN-β-Luc and pGL4.75 hRluc/CMV together with increasing quantities of plasmids (i.e., 0.5, 1, and 2 μg) encoding for AGO2. At 24 h post transfection, the cells were further infected with SeV or mock infected for 16 h before luciferase assays were performed. Data are presented as the means ± SD from three independent experiments. ***P < 0.0001, as determined by a t test.

