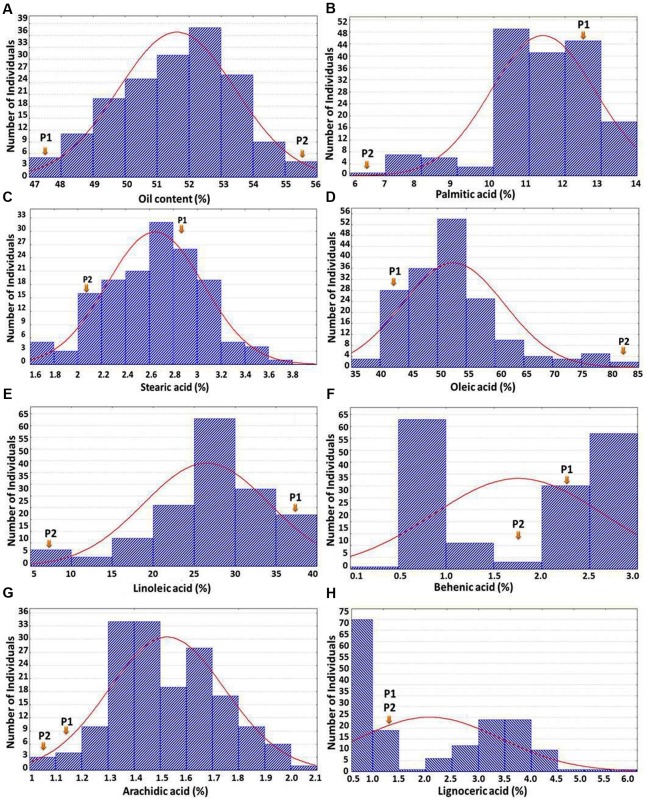
FIGURE 1.
Frequency distribution of oil content and seven different fatty acids. The X-axis shows the percentage of the trait and the Y-axis represents the number of individuals in F2 population. P1 and P2 represent the parents ICGV 07368 and ICGV 06420, respectively, in (A); while P1 and P2 represent the parents ICGV 06420 and SunOleic 95R, respectively, in (B–H).

