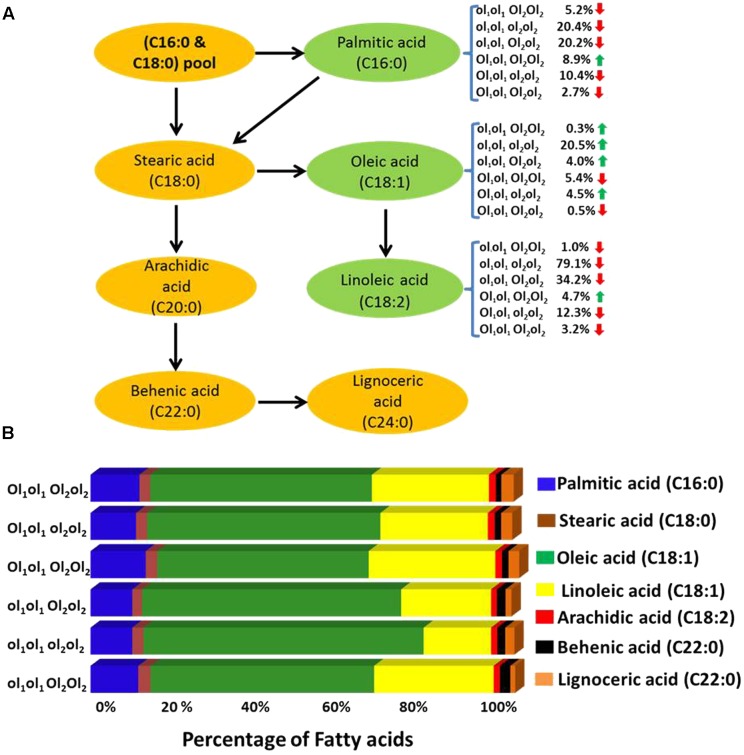
FIGURE 3.
(A) The effect of FAD mutant allele combinations of different fatty acids. The ol1 and Ol1 represent the mutant and the wild type allele, respectively, of A subgenome while ol2 and Ol2 represent the mutant and the wild type allele, respectively, of B subgenome. Red and green arrow indicates the decrease and increase of the fatty acid percentage levels, respectively. (B) Mean fatty acid composition (%) in plants possessing different mutant FAD allele (mutant and wild) combinations in fatty acid (FA)-population.

