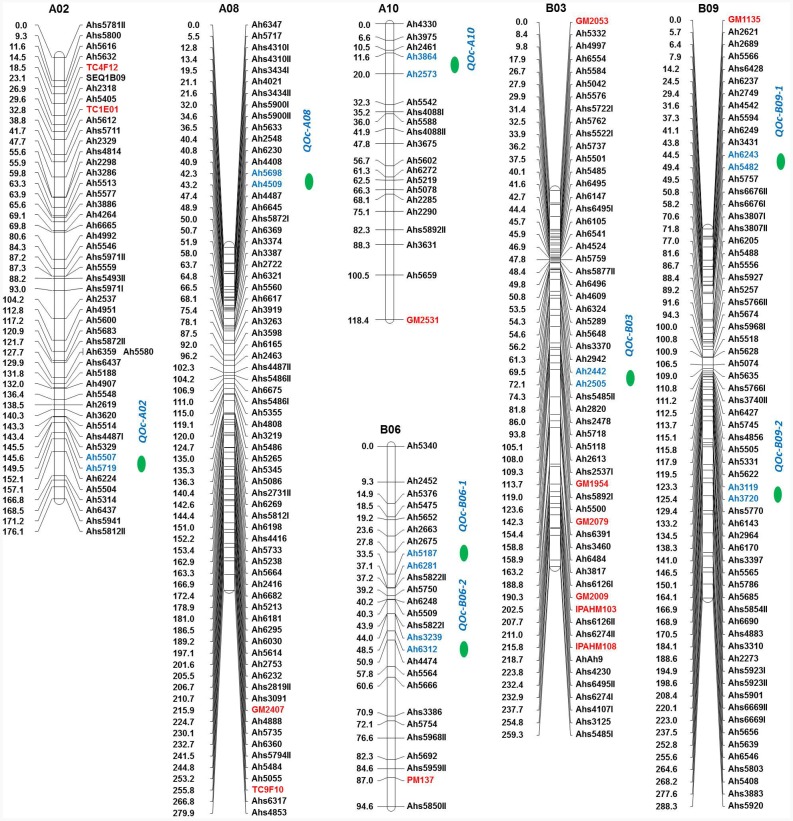
FIGURE 4.
Genetic map of the oil content (OC) population showing quantitative trait locus (QTLs) for oil content. For each linkage group (LG), marker loci are given on the right side of the bar and marker positions (in cM) are mentioned on the left side. Markers with red color indicate the SSRs while markers in blue color represent the flanking markers of the identified QTL region. QTL location is indicated with a green color circle.

