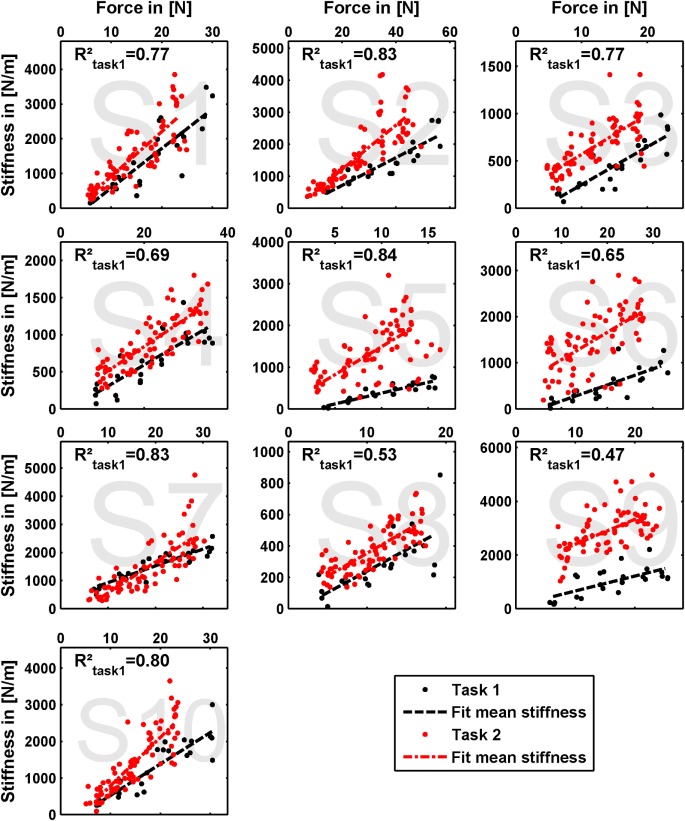
Figure 6.
Measured grip stiffness and its dependency on grip force. The results are depicted as dots denoting the single perturbations. For both tasks, a linear regression between force and stiffness over all values is shown. For task 1, we additionally calculated the corresponding coefficient of determination as a measure of linearity.

