Figure 1.
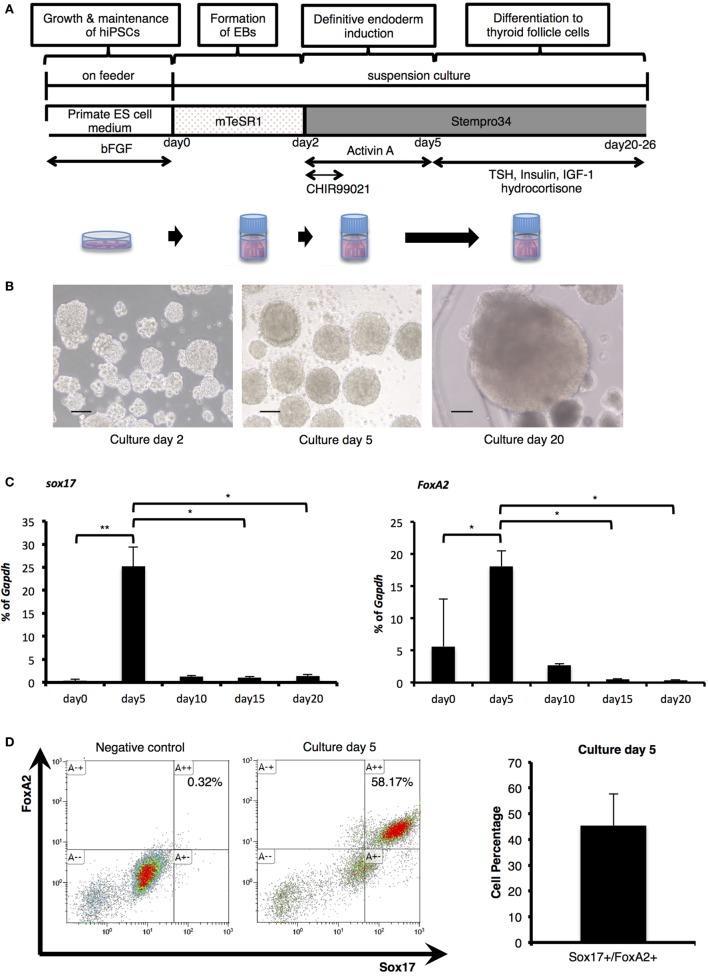
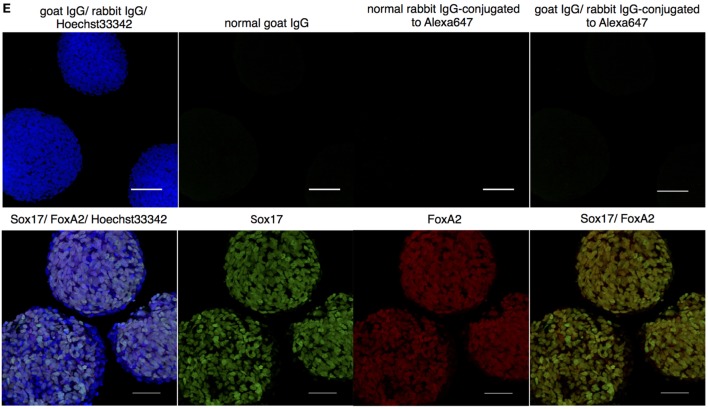
Endodermal differentiation of human induced pluripotent stem cells (iPSCs). (A) Schematic diagram of the induction protocol for definitive endoderm production from human iPSCs. (B) Embryoid bodies (EBs) collected pre- and post-Activin A exposure, as observed by light microscopy on culture days 2, 5, and 20. Scale bar = 100 µm. (C) Real-time reverse-transcription polymerase chain reaction analysis of definitive endodermal markers. Significant differences in Sox17 were detected between EBs after Activin A exposure (culture day 5) and samples on culture day 0, day 15, and day 20. In addition, FoxA2 expression on day 5 was significantly increased in comparison with cultures on day 0, and decreased with significant differences between those of day 15 and day 20. Bars indicate average percentage of Gapdh gene expression ±SD; (*p < 0.05, **p < 0.01 versus day 5, n = 3). Statistical analysis was performed by one-way ANOVA and post hoc Tukey’s test. (D) Percentage of Sox17- and FoxA2-expressing cells as counted by flow cytometry. After stimulation with Activin A for 3 days, the rate of Sox17 and FoxA2 double-positive cells increased to more than 45%, with a maximum of 58%. Bars indicate average percentage of Sox17- and FoxA2-expressing cells ± SD (n = 3). (E) Immunostaining of EBs on day 5 with anti-Sox17 and anti-FoxA2 antibodies. Images in the upper line present negative control. Images in the lower show Hoechst33342 for nuclei (blue) and Sox17 (green) and FoxA2 (red). Scale bar = 100 µm in the upper line and 50 µm in the lower.


