Figure 2.
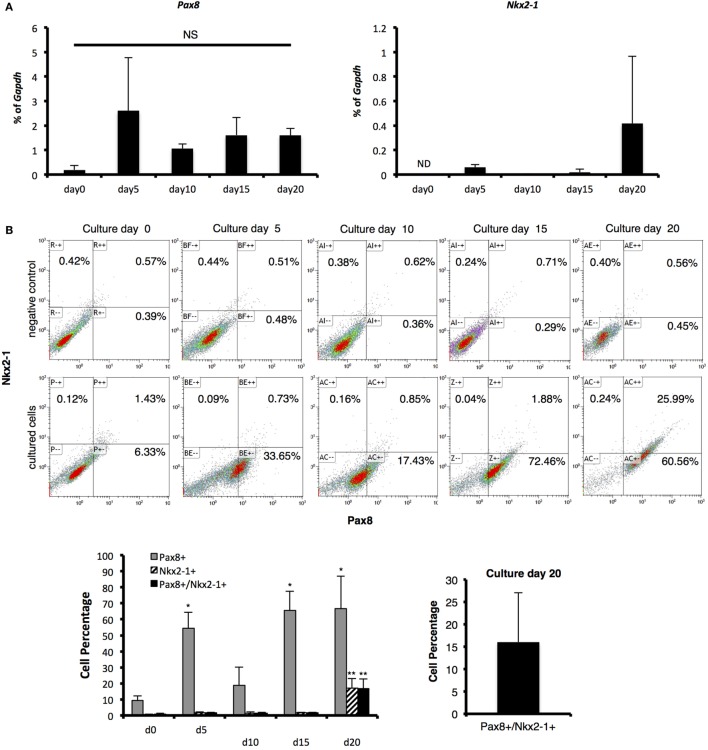
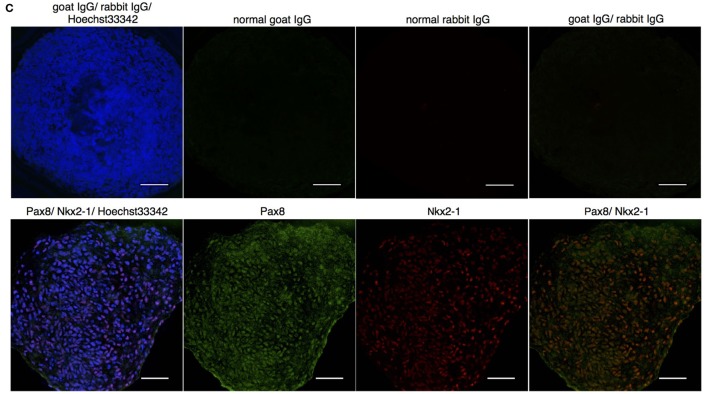
Identification of thyroid transcription markers. (A) Pax8 and Nkx2-1 mRNA expression as measured with real-time reverse-transcription polymerase chain reaction. Levels of gene expression were normalized to Gapdh. Bars indicate average percentage of Gapdh gene expression ± SD (n = 3). ND indicates mRNA expression was not detected and NS indicates not significant. There was no significant difference between all samples in Pax8 by ANOVA. (B) Percentage of Pax8 and Nkx2-1 co-expressing cells as counted by flow cytometry. Pax8-positive cells increased in 5 days to more than 50%, which was maintained until day 20, except for a transient decrease on day 10. Percentage of Pax8 and Nkx2-1 double-positive cells increased in a time-dependent manner, resulting in 16% approximately on culture day 20. Negative controls were applied for normal IgG instead of primary antibodies. Bars indicate average percentage of Pax8- and Nkx2-1-coexpressing cells ± SD (n = 3). Statistical analysis was performed by one-way ANOVA. (C) Immunohistological analysis of Pax8 and Nkx2-1. Images in the upper line present negative controls. Images in lower show Pax8 (green), Nkx2-1 (red), and Hoechst33342 (blue). Scale bar = 50 µm.


