Figure 3.
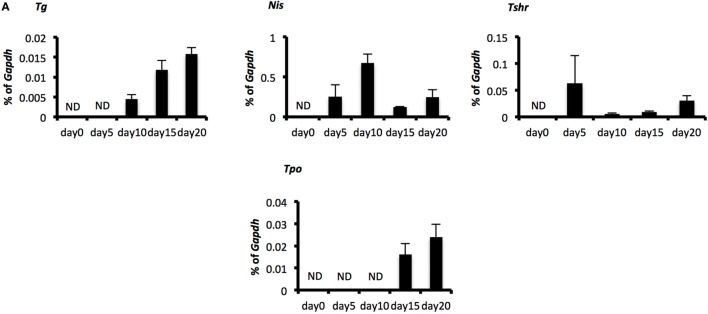
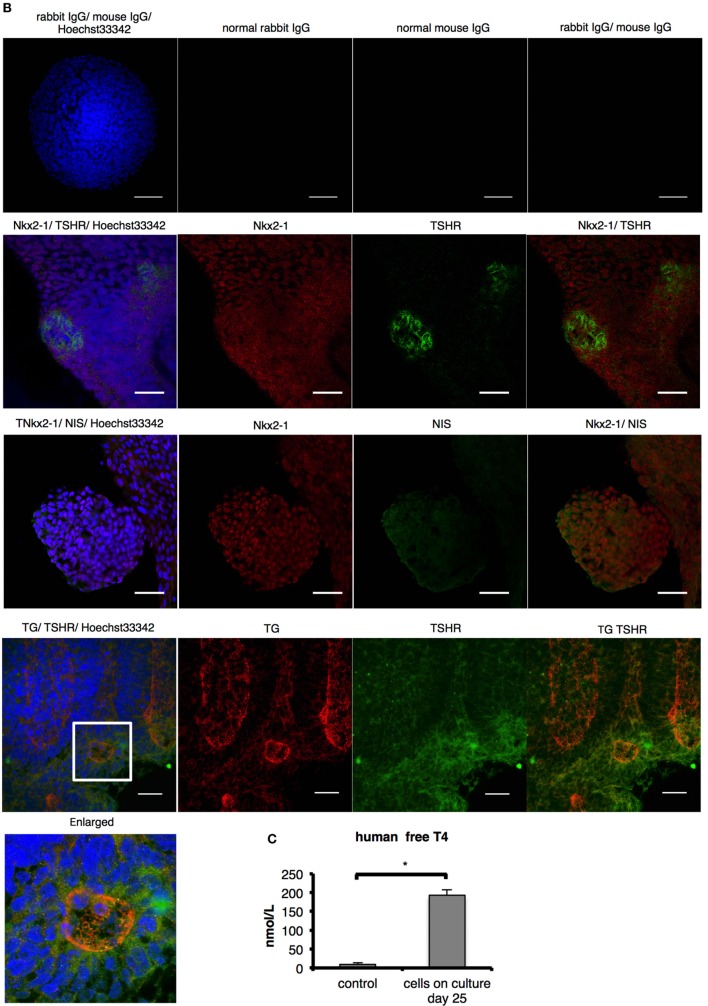
Evaluation of thyroid specificity with characteristic thyroid markers on culture day 20 and measurement of free T4. (A) Levels of thyroid-specific mRNA expression. Bars indicate average percentage of Gapdh gene expression ± SD (n = 3). ND, not-detected. (B) Immunostaining of embryoid bodies on day 20 with thyroid-specific markers NIS, thyroglobulin, and thyroid-stimulating hormone receptor. Images in the top line present negative controls. Scale bar = 50 µm in the top line, 30 µm in the lower lines. (C) Levels of human-free T4 were higher significantly in the cultured-cell medium than in the control medium (*p < 0.01). Control medium is thyroid-stimulating hormone-supplemented medium before cells were harvested. Bars indicate average-free T4 levels ± SD (n = 3). Statistical analysis was performed by unpaired Student’s t-test.


