
Fig. 4.
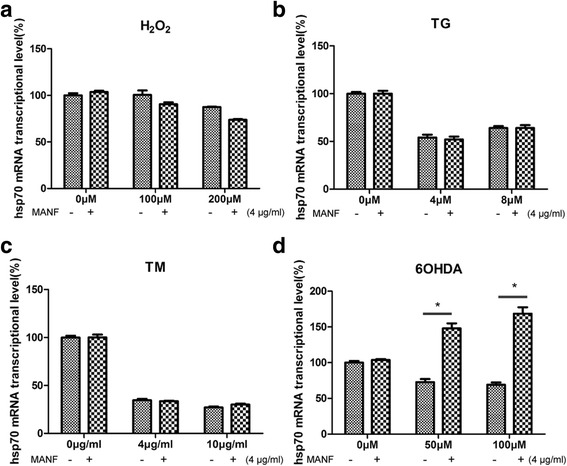
MANF did not upregulate HSP70 expression levels under H2O2 TG and TM treatment in SHSY-5Y cells. a Real-time PCR quantitation of HSP70 mRNA levels in control, H2O2 and H2O2 + MANF treatment group (mean ± SEM, n = 5). The relative mRNA expression levels of HSP70 in SHSY-5Y cells were normalized to those of β-actin. b Real-time PCR quantitation of HSP70 mRNA levels in control, TG and TG + MANF treatment group (mean ± SEM, n = 5). c Real-time PCR quantitation of HSP70 mRNA levels in control, TM and TM + MANF treatment group (mean ± SEM, n = 5). d Real-time PCR quantitation of HSP70 mRNA levels in control, 6-OHDA and 6-OHDA + MANF treatment group (mean ± SEM, n = 5). The relative mRNA expression levels of HSP70 in SHSY-5Y cells were normalized to those of β-actin