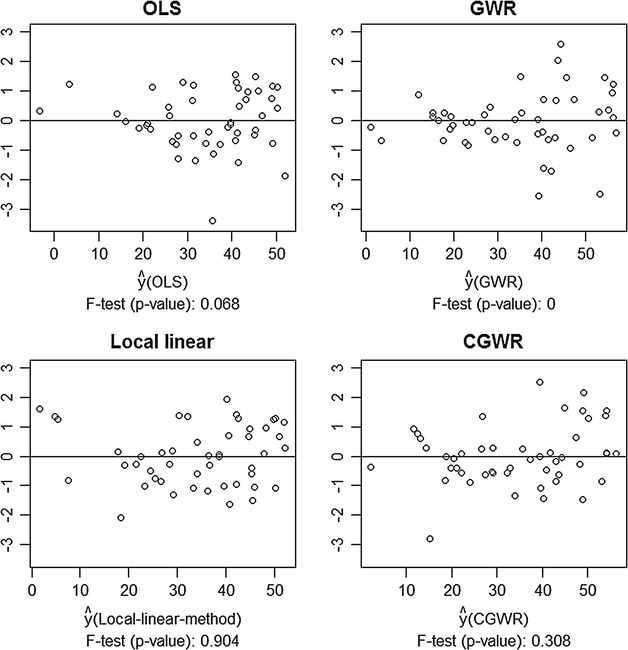
Fig. 10.

Residual plots of various models (Ohio data). Different residual plot from Ohio crime data. Note that the data are cut into half according to fitted values before conducting F test. The data are cut into half according fitted values before conducting constant variance test. For example, the middle point of GWR fitted values is around 29.1. We first split the data to two sets (before 29.1 and after 29.1). After that, F test is conducted to test whether both parts have equal variance (i.e. ), which is the basic assumption in regression analysis. Small p value indicates constant variance assumption is not likely to be true
