Fig. 9.

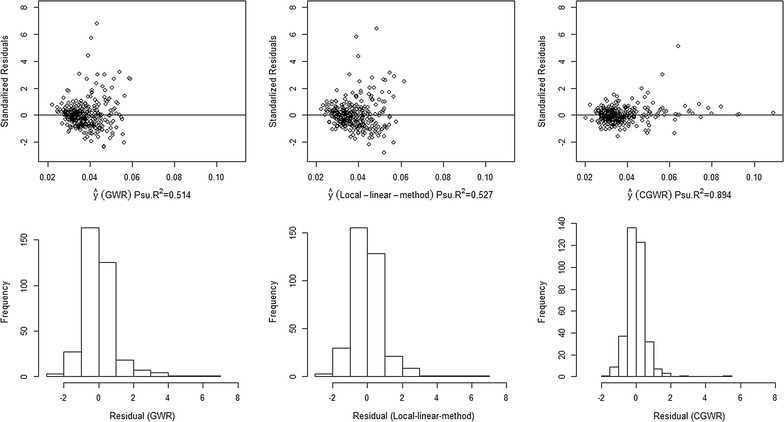
Residual plots for different GWR methods (Taiwan data). These plots illustrate the residual analysis after fitting with different model. The residuals are generated from Taiwan disability data

Residual plots for different GWR methods (Taiwan data). These plots illustrate the residual analysis after fitting with different model. The residuals are generated from Taiwan disability data