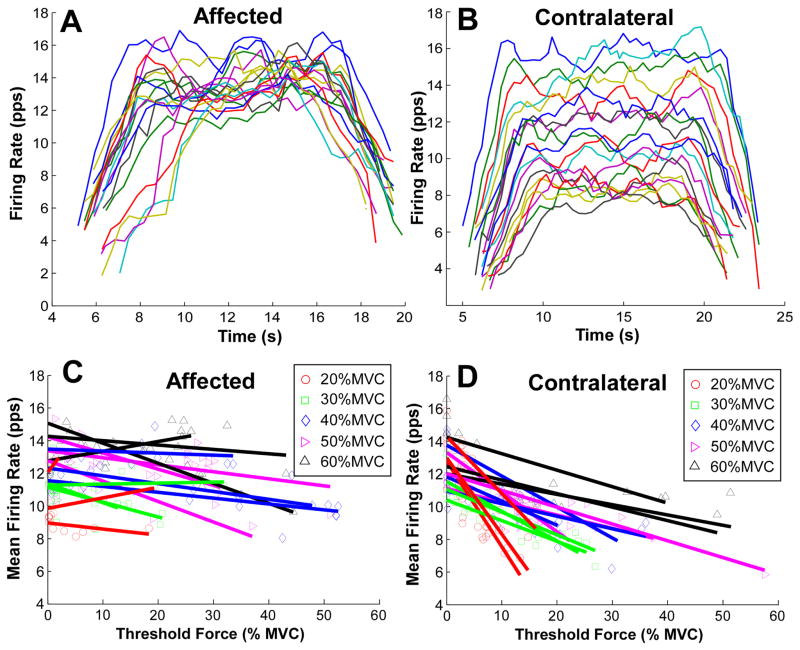
Figure 2.
Firing rate patterns of an exemplar contraction and of an exemplar stroke survivor. (A) Firing rate over time of concurrently active units from the affected muscle producing a 40% MVC contraction. (B) Firing rate over time of concurrently active units from the contralateral muscle. (C) Firing rate and recruitment threshold in the affected muscle. Individual linear regressions were performed on concurrently active units. Different symbols and colors represent different muscle contraction levels. (D) Firing rate and recruitment threshold in the contralateral muscle.

