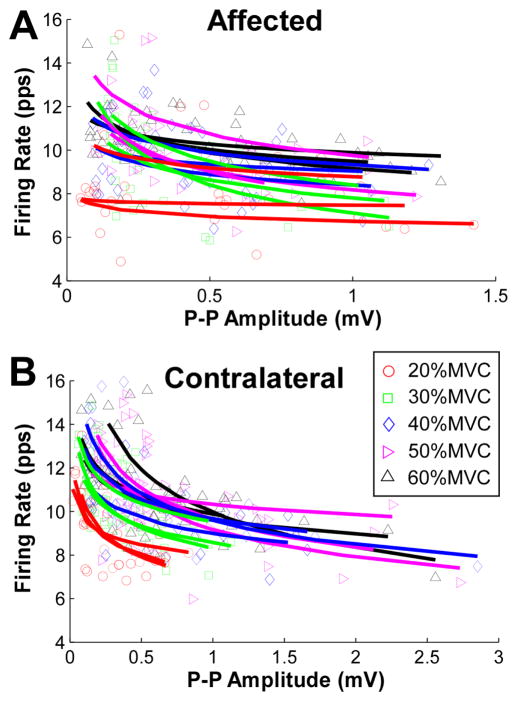
Figure 5.
Mean firing rate as a function of MU size (estimated based on spike triggered averaging) of an exemplar stroke survivor. (A) Firing rate and MU size in the affected muscle. Individual regressions of an inverse power function were performed on concurrently active units. Different symbols and colors represent different muscle contraction levels. (B) Firing rate and MU size in the contralateral muscle.

