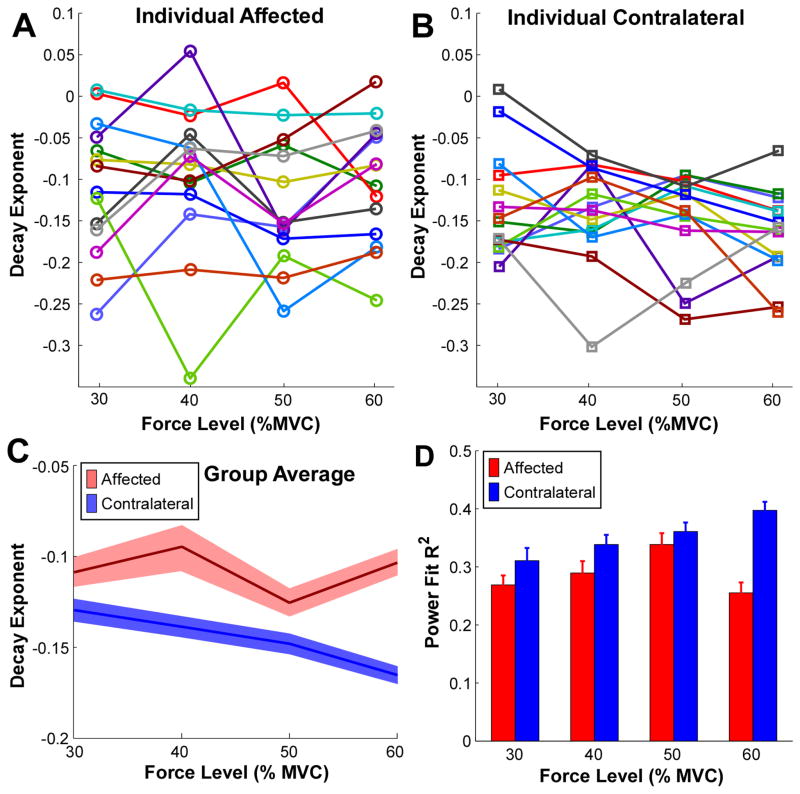
Figure 6.
Decay exponent of the inverse power function at different muscle contraction levels. (A) Decay exponent on the affected side at different muscle contraction levels of all the subjects. One color represents an individual subject. (B) Decay exponent on the contralateral side at different muscle contraction levels. (C) Group averaged decay exponents in the affected and the contralateral muscles. The solid lines represent the average values and the shaded region represents the standard error across 14 subjects. (D) Regression R2 comparisons between the affected and the contralateral muscles. Error bars represent standard errors.

